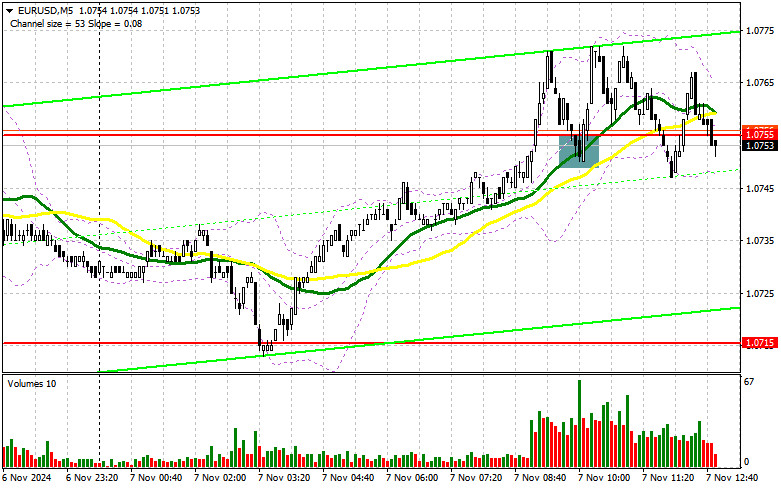
In my morning forecast, I highlighted the 1.0755 level as key for making market entry decisions. Let's examine the 5-minute chart to assess the events. A breakout and subsequent retest of this range provided an entry point for euro purchases. However, after a 15-point rise, demand for risk assets waned. The technical picture has since been revised for the second half of the day.
To Open Long Positions on EUR/USD:
The euro's growth prospects hinge on today's Federal Reserve meeting and, more specifically, the comments from Fed Chair Jerome Powell. I will refrain from making rushed market entry decisions. If Powell unexpectedly adopts a cautious stance on rate cuts, citing potential inflation spikes from the Trump administration's policies, the euro is likely to resume its decline. Otherwise, the pair's correction may continue.
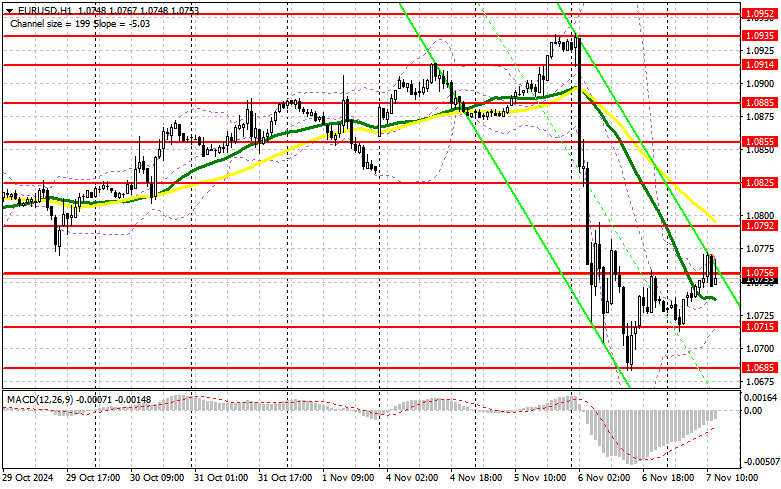
If the euro declines, a false breakout near 1.0715 would create favorable conditions for increasing long positions, enabling the correction to target the 1.0756 level, where trading is concentrated. A breakout and retest of this range will confirm an optimal entry point for purchases, aiming for levels at 1.0792 and 1.0825. The ultimate target is 1.0855, where I plan to secure profits.
If there is no activity around 1.0715 in the second half of the day, the euro risks falling back to its weekly low. In this scenario, I will only enter the market following a false breakout near the next support at 1.0685. Long positions on a rebound will be considered only from 1.0642, targeting a 30-35 point upward correction within the day.
To Open Short Positions on EUR/USD:
Sellers will focus on defending the 1.0792 resistance level, established during yesterday's session. A false breakout at this level, combined with Powell's hawkish tone, will provide a selling opportunity, targeting the 1.0756 support. A breakout and consolidation below this range, followed by a retest from below, will offer another selling opportunity, aiming for the weekly low of 1.0715. This would establish a new bearish trend. The ultimate target is the 1.0685 zone, where profits will be secured.
If the pair rises and sellers fail to defend the 1.0792 level (unlikely), buyers could build a larger correction. In this case, I will defer selling until the next resistance at 1.0825 is tested. Selling will only occur after a failed consolidation at this level. Short positions on a rebound will also be considered from 1.0855, aiming for a 30-35 point downward correction.
COT Report Analysis:
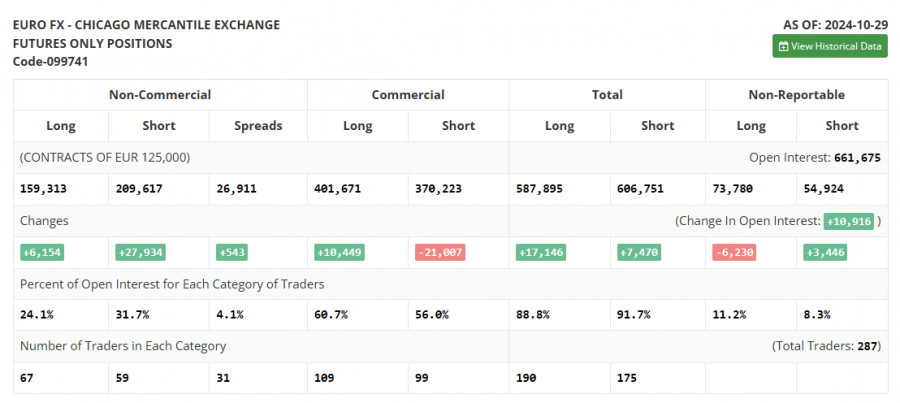
The COT (Commitment of Traders) report dated October 29 showed a sharp rise in short positions and a modest increase in long positions. It is important to note that the report does not include recent U.S. labor market data or reactions to public opinion polls on the presidential election. Additionally, this week's Fed meeting and the expected rate cut reduce the report's significance.
Non-commercial long positions rose by 6,154 to 159,313, while short positions increased by 27,934 to 209,617. Consequently, the net position widened by 543 contracts.
Indicator Signals:
Moving AveragesTrading is occurring around the 30- and 50-day moving averages, indicating market uncertainty.
Note: The author analyzes moving averages on the H1 hourly chart, which differs from the standard definition of daily moving averages on the D1 chart.
Bollinger BandsIn case of a decline, the lower boundary of the indicator around 1.0715 will act as support.
Indicator Descriptions:
- Moving Average (MA): Averages prices to identify trends by smoothing out volatility and noise. Period – 50, marked in yellow on the chart.
- Moving Average (MA): Averages prices to identify trends by smoothing out volatility and noise. Period – 30, marked in green on the chart.
- MACD (Moving Average Convergence/Divergence): Measures the convergence/divergence of moving averages. Fast EMA – period 12, Slow EMA – period 26, SMA – period 9.
- Bollinger Bands: A volatility indicator with a period of 20.
- Non-commercial traders: Speculators like individual traders, hedge funds, and large institutions that use the futures market for speculative purposes and meet specific criteria.
- Non-commercial long positions: The total long positions held by non-commercial traders.
- Non-commercial short positions: The total short positions held by non-commercial traders.
- Net non-commercial position: The difference between long and short positions of non-commercial traders.


