The EUR/USD pair traded poorly on Friday. While this wasn't apparent in the 4-hour timeframe, it was evident in the 5-minute chart. The price oscillated between stagnation, sharp rises, and equally sharp declines. Friday proved particularly challenging as the European trading session appeared to be merely a prelude to the release of US labor market data, which, once published, triggered volatile price swings. Mixed signals can explain the initial upward movement followed by a subsequent decline: a rising unemployment rate (negative for the dollar) countered by a stronger-than-expected increase in non-farm payrolls (positive for the dollar). This duality makes sense in hindsight, but trading through it was exceedingly difficult.
The entire past week was convoluted and ambiguous. Although the economic calendar was packed with macroeconomic reports and fundamental events, no groundbreaking information emerged. Reports such as ISM, ADP, JOLTs, NonFarm Payrolls, and the unemployment rate are not minor data points, yet the market traded as if no significant updates were received, relying instead on technical corrections. This aligns with our expectations, as we've consistently maintained that there are no compelling reasons for the euro to strengthen, especially after last week's statements from Christine Lagarde and Jerome Powell. As anticipated, the upward correction appears to be prolonged.
The upcoming week in the Eurozone and Germany features a light event schedule. Reports on German inflation (second estimate) or European industrial production are unlikely to attract much attention. However, Thursday will see the final European Central Bank meeting of the year, where a decision to cut key rates by 0.25% is highly likely. There's also a possibility of a 0.5% cut, but in either case, it could deal another blow to the euro.
It's worth noting that the market hasn't yet priced in the ECB's monetary policy easing. The ECB initially intended to cut rates once every two meetings but has now adopted a policy of easing at every meeting. This is another factor that could contribute to the euro's decline. We've long held a bearish view on the euro, and this outlook has only strengthened.
A few weeks ago, the euro found temporary relief from a horizontal channel on the weekly timeframe, rebounding from its lower boundary. However, this bounce doesn't guarantee a move toward the opposite boundary. We believe the downtrend will resume in due course.
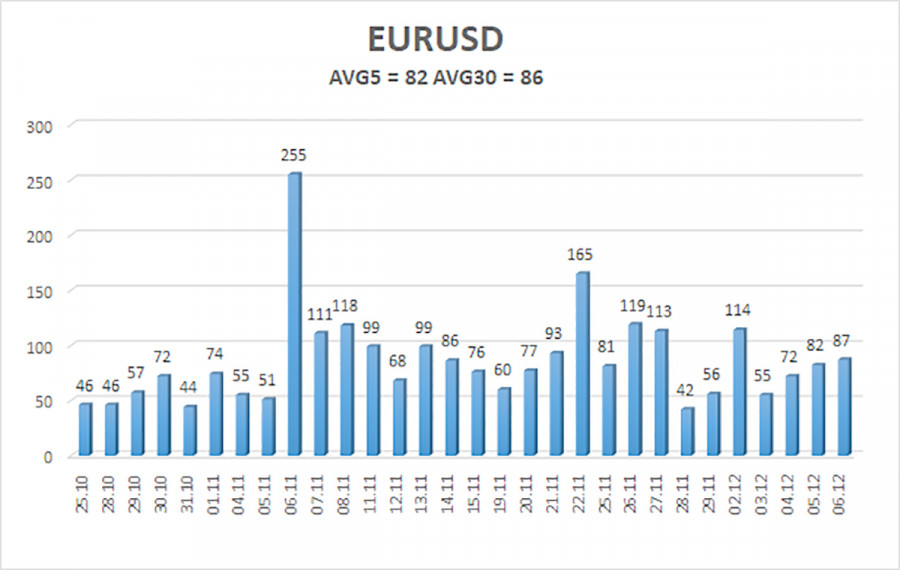
The EUR/USD pair's average volatility over the past five trading days as of December 9 is 82 pips, considered "average." For Monday, we anticipate the pair moving within the range of 1.0486 to 1.0650. The higher linear regression channel is directed downwards, and the global downtrend persists. The CCI indicator has dipped into oversold territory several times, sparking an ongoing upward correction.
Support Levels:
- S1: 1.0498
- S2: 1.0376
- S3: 1.0254
Resistance Levels:
- R1: 1.0620
- R2: 1.0742
- R3: 1.0864
Trading Recommendations:
The EUR/USD pair could resume its downtrend at any moment. For months, we've emphasized a bearish medium-term outlook for the euro and continue to favor the overall bearish trend. Likely, the market has already priced in—or nearly priced in—any forthcoming Federal Reserve rate cuts. As such, there are still no significant reasons for a medium-term dollar decline, which was scarce even before. Short positions can be considered with targets at 1.0376 and 1.0254 if the price consolidates below the moving average. If you are trading on the "pure" technique, then long positions can be considered only if the price holds above the moving average, with targets at 1.0620 and 1.0643, but we currently advise against opening long positions.
Explanation of Illustrations:
Linear Regression Channels help determine the current trend. If both channels are aligned, it indicates a strong trend.
Moving Average Line (settings: 20,0, smoothed) defines the short-term trend and guides the trading direction.
Murray Levels act as target levels for movements and corrections.
Volatility Levels (red lines) represent the likely price range for the pair over the next 24 hours based on current volatility readings.
CCI Indicator: If it enters the oversold region (below -250) or overbought region (above +250), it signals an impending trend reversal in the opposite direction.


