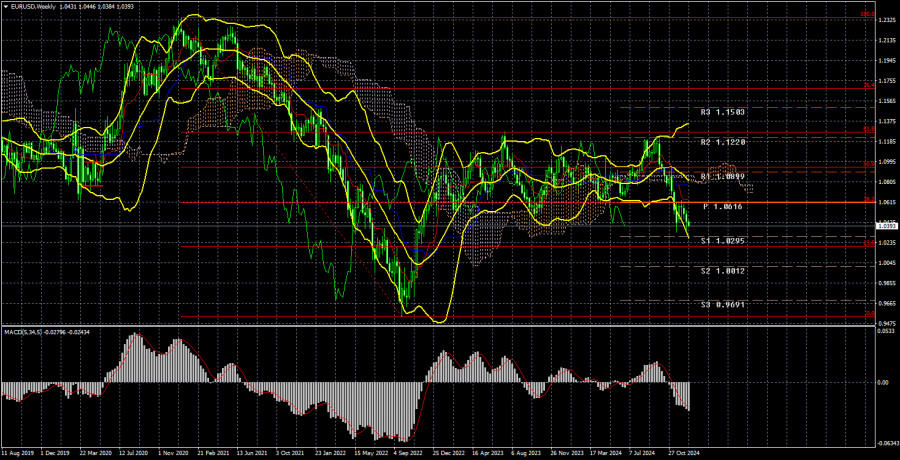
The EUR/USD pair did not trade on Wednesday due to Christmas celebrations in many countries, including the US and the EU. Holidays provide a great opportunity to reflect on the past year. Throughout this year, we often referenced the weekly timeframe (TF), so today we will analyze it in more detail.
When analyzing any financial instrument, it's crucial to start with higher timeframes, such as the weekly or even monthly charts, to understand the overall structure. Most traders aim to identify trends, and overlooking higher timeframes can make it difficult to determine the direction of a broader trend, as local trends can end quickly.
The long-term trend of the euro, spanning 16 years, is not fully visible even on the weekly time frame. The decline of the euro began at the 1.60 level. While the euro is generally not considered a volatile currency, it has depreciated by nearly half against the dollar over these 16 years. This observation underscores the long-term dominance of the dollar, primarily because the U.S. economy remains the strongest in the world. Investors tend to favor placing their funds in a growing and outperforming economy rather than in a weaker one.
Examining the weekly time frame, we see that after another decline from 2021 to 2022, a prolonged correction began. During this correction, the price reached the 61.8% Fibonacci level. It's important to note that the 61.8% level is significant, and its testing often indicates the end of a correction. As observed, after testing this level twice, the euro began a strong decline.
Where could the euro's decline potentially target if the downward trend continues? It would likely be below the previous low of $0.95. Of course, having a contingency plan is essential, as every trend eventually comes to an end. However, we believe that price parity for the euro is inevitable. We have been discussing this goal since the beginning of 2024, and it remains relevant. Achieving this would require just another 400 pips, which is relatively small for a weekly timeframe.
We have consistently outlined the fundamental reasons behind this trend. The key factor is the market's preemptive pricing in of the entire Fed's monetary easing cycle—possibly even overpricing it. The Fed cannot and will not lower rates as quickly or as significantly as the market had expected. After September 18, the dollar essentially ran out of reasons to weaken because the primary bearish factor had already been fully priced in.
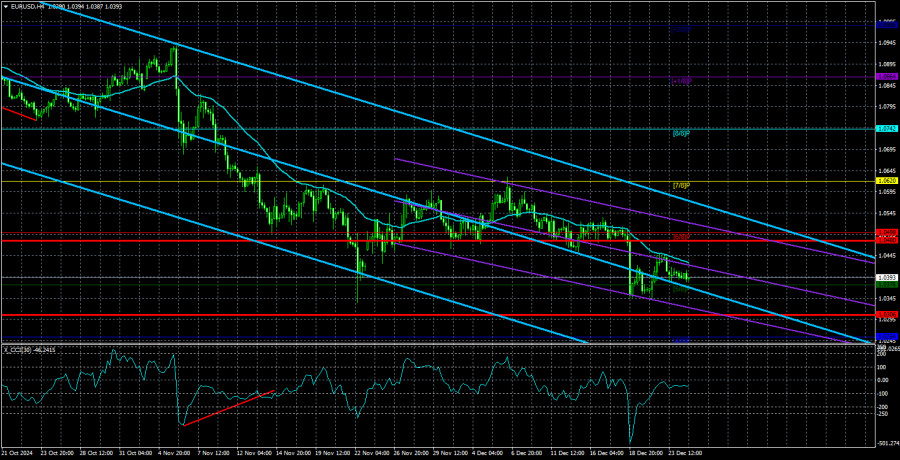
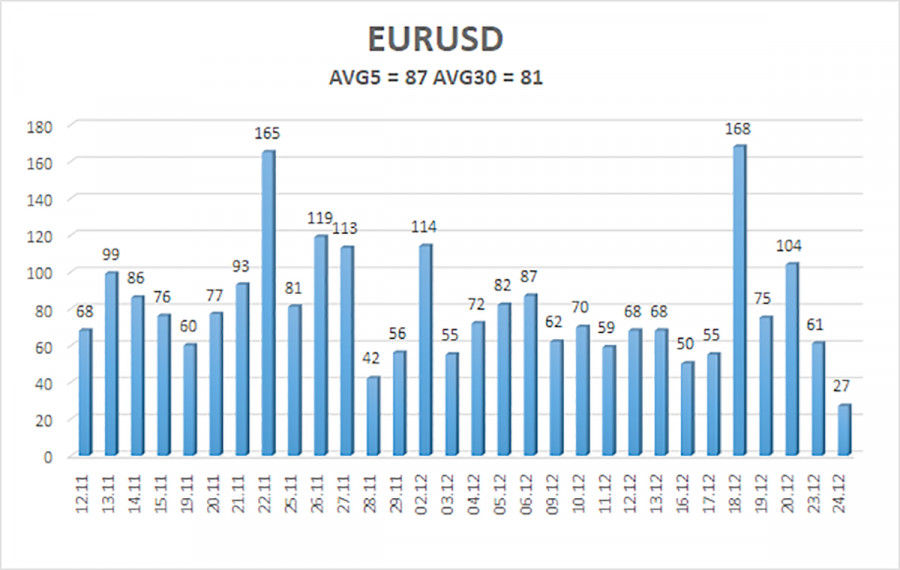
The average volatility of the EUR/USD currency pair over the last five trading days, as of December 25, is 87 pips, which is considered "moderate." We expect the pair to move within the range of 1.0306 to 1.0480 on Thursday. The upper linear regression channel is trending downward, indicating that the global bearish trend is still in effect. Additionally, the CCI indicator has entered the oversold zone again following a sharp decline, suggesting a potential correction may be on the horizon.
Key Support Levels:
- S1 – 1.0376
- S2 – 1.0254
- S3 – 1.0132
Key Resistance Levels:
- R1 – 1.0498
- R2 – 1.0620
- R3 – 1.0742
Trading Recommendations:
The EUR/USD pair is expected to continue its downward trend. Over the past few months, we have consistently maintained the view that the euro will face declines in the medium term, fully supporting an overall bearish outlook. There is a high likelihood that the market has already accounted for all anticipated Fed rate cuts. Consequently, the dollar lacks significant reasons for a medium-term decline, having had few to begin with.
Short positions remain the most relevant strategy, with target levels of 1.0306 and 1.0254, as long as the price remains below the moving average (MA). For those who trade based on "pure" technical analysis, long positions can only be considered if the price rises above the MA, with a target of 1.0620. However, we currently do not recommend any long positions.
Explanation of Illustrations:
Linear Regression Channels help determine the current trend. If both channels are aligned, it indicates a strong trend.
Moving Average Line (settings: 20,0, smoothed) defines the short-term trend and guides the trading direction.
Murray Levels act as target levels for movements and corrections.
Volatility Levels (red lines) represent the likely price range for the pair over the next 24 hours based on current volatility readings.
CCI Indicator: If it enters the oversold region (below -250) or overbought region (above +250), it signals an impending trend reversal in the opposite direction.


