GBP/USD 5-Minute Analysis
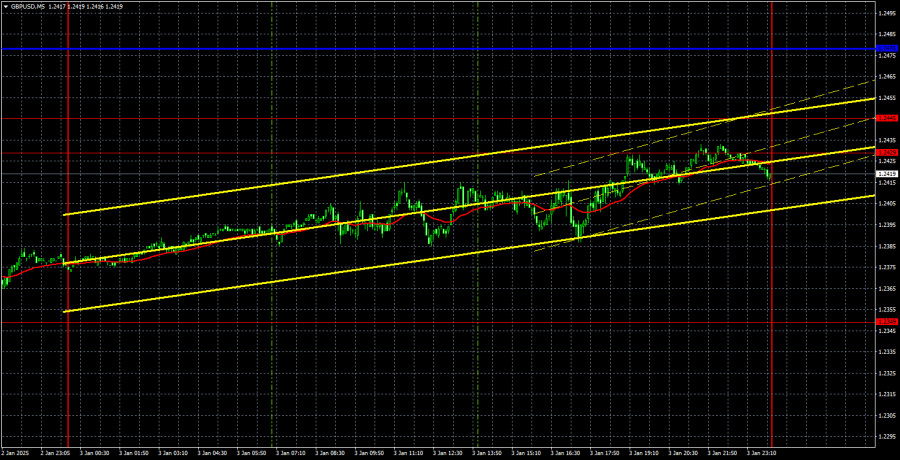
The GBP/USD pair made an active recovery on Friday after experiencing a nearly 200-pip drop on Thursday. The price reached the level of 1.2349 almost perfectly on the first trading day after exiting the horizontal channel it had been trading in during the holidays. Currently, the pound has managed a modest recovery to the 1.2429–1.2445 zone, from which it may see a bounce as early as Monday or Tuesday. If this occurs, a return to the 1.2349 level is likely.
It's important to note that the pound cannot decline indefinitely or every single day; there will be pauses, corrections, and pullbacks. For instance, during the holiday period, the GBP/USD pair traded sideways for several weeks, even though it plunged 200 pips on the first trading day of the new year. This week, several key reports are expected in the U.S. that could potentially lead to a decline in the dollar. Traders should monitor these significant reports closely over the next five days. However, even if all these reports turn out to be weak, it is unlikely to reverse the global downtrend or even the local three-month trend. The main question now is how strong and prolonged the next correction will be.
On Friday, there were no actionable trading signals on the 5-minute timeframe. However, on Thursday, the price rebounded from the 1.2349 level, which could have been utilized for trading. On Friday, there was another bounce from the 1.2429–1.2445 zone. It was not advisable to open short positions near the market close, but if this signal remains valid on Monday, short positions may become relevant.
COT Report
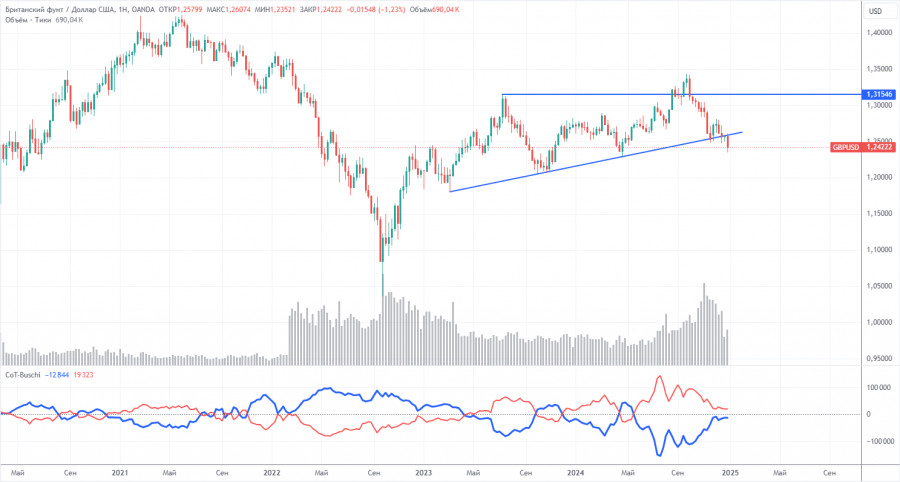
The Commitments of Traders (COT) reports for the British pound indicate that the sentiment of commercial traders has been highly volatile in recent years. The red and blue lines, representing the net positions of commercial and non-commercial traders, frequently intersect and generally hover near the zero mark. On the weekly timeframe, the price initially broke below the 1.3154 level and subsequently moved down to the trendline, which it breached this week. This breach of the trendline strongly suggests that the pound's decline is likely to continue.
According to the latest COT report, the "non-commercial" group closed 3,700 buy contracts and 1,400 sell contracts. As a result, the net position of non-commercial traders decreased by 2,300 contracts over the week.
The current fundamental outlook does not support any long-term purchases of the British pound. The currency seems likely to continue its global downtrend. Consequently, the net position may keep declining, indicating a reduced demand for the pound sterling.
GBP/USD 1-Hour Analysis
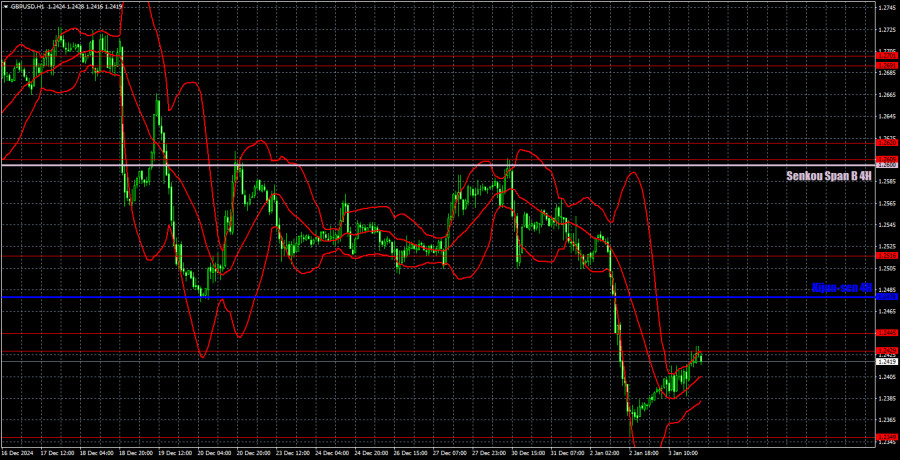
On the hourly timeframe, the GBP/USD pair generally maintains a bearish outlook, although a new corrective phase has begun. Currently, there are no fundamental drivers suggesting that the pound will strengthen, apart from the occasional technical need for corrections. The meetings of the Bank of England and the Federal Reserve may have exerted some negative influence on the dollar, but they ultimately placed additional pressure on the pound. In the medium term, we continue to anticipate a decline in the British currency.
For January 6, the following key levels are highlighted: 1.2269, 1.2349, 1.2429-1.2445, 1.2516, 1.2605-1.2620, 1.2691-1.2701, 1.2796-1.2816, 1.2863. The Senkou Span B line (1.2600) and the Kijun-sen line (1.2478) may also serve as signal sources. It is advisable to set the Stop Loss at breakeven once the price moves 20 pips in the desired direction. Keep in mind that the Ichimoku indicator lines may shift throughout the day, so this should be taken into account when identifying trading signals.
On Monday, the UK and US are scheduled to release second estimates of services sector PMIs, which we consider relatively insignificant. The market is more likely to focus on the US ISM Services PMI released on Friday, which was much stronger than expected. The 1.2429-1.2445 zone is currently critical for the pound, as it could signal the beginning of another decline in the British currency.
Illustration Explanations:
- Support and Resistance Levels (thick red lines): Thick red lines indicate where movement may come to an end. Please note that these lines are not sources of trading signals.
- Kijun-sen and Senkou Span B Lines: Ichimoku indicator lines transferred from the 4-hour timeframe to the hourly timeframe. These are strong lines.
- Extreme Levels (thin red lines): Thin red lines where the price has previously bounced. These serve as sources of trading signals.
- Yellow Lines: Trendlines, trend channels, or any other technical patterns.
- Indicator 1 on COT Charts: Represents the net position size for each category of traders.


