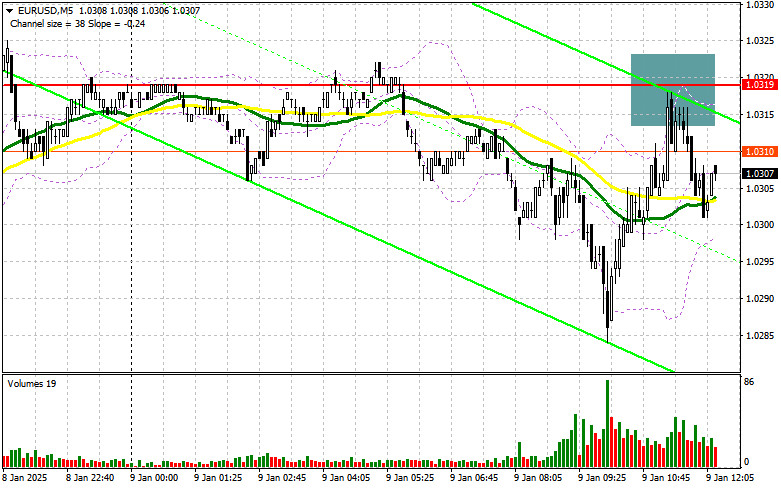
In my morning forecast, I highlighted the level of 1.0319 and planned to make trading decisions based on it. Let's examine the 5-minute chart to analyze the developments. A rise and false breakout at this level provided a selling opportunity for the euro, but a significant drop in the pair has yet to materialize. The technical picture for the second half of the day remains unchanged.
To open long positions on EUR/USD:
Today's German data surprised many, allowing the euro to halt its decline against the US dollar. According to the report, industrial production increased by 1.5% compared to the previous month, significantly outperforming the economists' forecast of a 0.5% rise. No major US statistics are expected in the second half of the day, and the Challenger Job Cuts report will likely be overlooked in favor of tomorrow's critical data releases. Attention will shift to speeches by FOMC members Patrick T. Harker, Thomas Barkin, and Michelle Bowman, who will discuss the Fed's future policy on interest rates. Should the market conclude that rate cuts are unlikely in the near term, which is the most probable scenario, pressure on the euro will return.
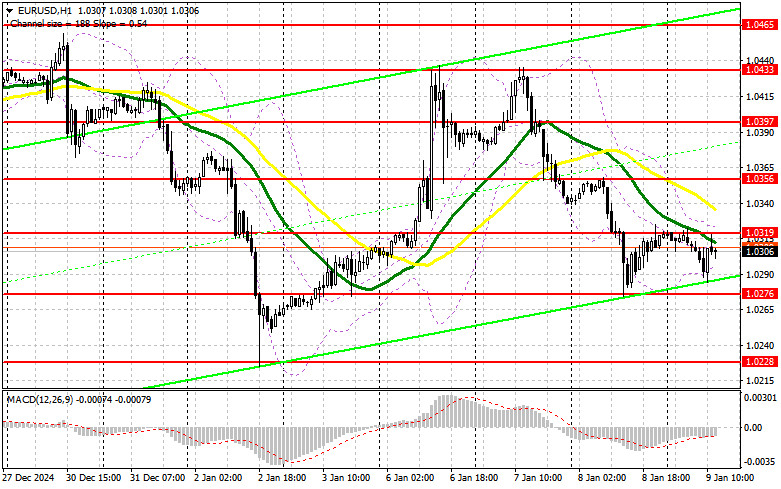
For this reason, my focus will remain on the nearest support at 1.0276, which performed well in yesterday's first half. A false breakout there will provide a good entry point for purchases, targeting the resistance level of 1.0319. A breakout and subsequent retest of this range will confirm a solid buy entry, aiming for a move toward 1.0356. The ultimate target will be the 1.0397 maximum, where I plan to take profits. If EUR/USD declines further and activity at 1.0276 is absent in the second half of the day, the pressure on the pair will likely increase, with sellers aiming for 1.0228, a monthly low. Only after a false breakout at this level will I consider buying the euro. I will open long positions immediately on a rebound from 1.0180, targeting a 30-35 point upward correction intraday.
To open short positions on EUR/USD:
Sellers are active, but their efforts are insufficient to sustain yesterday's bearish market. For this reason, it's better to wait for data releases and see whether large players will react again near the resistance level of 1.0319. A false breakout at this level, similar to the example discussed earlier, will provide a selling opportunity, targeting the support at 1.0276, which was not reached in the morning. A breakout and subsequent retest of this range from below will offer another suitable selling scenario, aiming for the yearly low of 1.0228, effectively restoring the bearish trend. The ultimate target will be the 1.0180 level, where I plan to take profits.
If EUR/USD rises in the second half of the day and there is no bearish activity near 1.0319, where the moving averages are located, I will postpone short positions until the pair tests the next resistance level at 1.0356. I will also sell there but only after an unsuccessful breakout. I plan to open short positions immediately on a rebound from 1.0397, targeting a 30-35 point downward correction intraday.
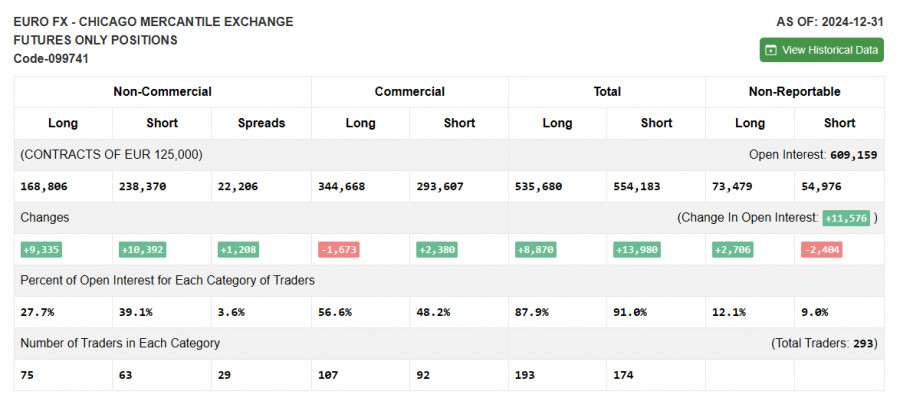
The Commitments of Traders (COT) report for December 31, 2024, indicated an increase in both short and long positions in nearly equal proportions. Given that the Federal Reserve's policy remained unchanged leading up to the new year, attention is likely to shift towards Donald Trump's inauguration and his protectionist rhetoric. However, statements from Federal Reserve officials will continue to play a significant role in the future trajectory of the U.S. dollar and should not be overlooked.
The COT report showed that non-commercial long positions increased by 1,644 to a total of 86,202, while non-commercial short positions rose by 132 to 65,367. Consequently, the gap between long and short positions widened by 1,226.
Signals from Indicators:
Moving Averages:
Trading occurs below the 30- and 50-day moving averages, indicating a further decline in the pair.
Bollinger Bands:
In case of a decline, the lower boundary of the indicator around 1.0290 will act as support.
Indicator Descriptions:
- Moving Average (MA): A trend-following indicator that smooths out price action. Periods: 50 (yellow on the chart) and 30 (green on the chart).
- MACD: Fast EMA - period 12; Slow EMA - period 26; SMA - period 9.
- Bollinger Bands: Period 20.
- Non-commercial traders: Speculators such as individual traders, hedge funds, and large institutions using the futures market for speculative purposes.
- Net non-commercial positions: The difference between non-commercial long and short positions.


