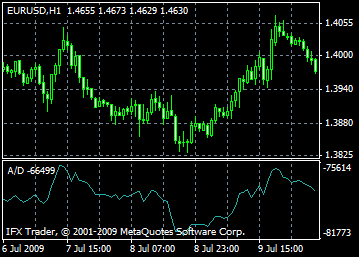
The price and volume variance are reflected by the technical indicator Accumulation Distribution, A/D. Measuring index when the price changes turns out to be the volume, when it increases, the price fluctuation affect on the indicator also rises.
This indicator is the analogue of more widespread indicator - On Balance Volume. These indexes are used for testing and confirming the price in terms of proper trading volume correction.
When Accumulation/Distribution (A/D) starts growing that means that you can begin purchasing or accumulating securities, as the trading volume part is related to the upside price movement. Sale or allocation of securities can be started at the moment when the indicator begins to fall, because the trading volume part is tightly concerned with the downward price motion.
It is possible to say about coming price adjustment in case of divergence between Accumulation/Distribution indicator and a stock. More often, in case of divergence the price changes its direction in accordance with the indicator. For example: if the index rises, the stock price ticks down, consequently, the price correction can be expected.

Calculation:
To/from the current indicator reading is added/deducted a certain part of day volume. If the closing price is near to the day maximum, then the size of addable part is bigger. If the closing price is near to the minimum – the deducted part is bigger. Being between a high and a low the indicator remains at the same level.
A/D(i) =((CLOSE(i) - LOW(i)) - (HIGH(i) - CLOSE(i)) * VOLUME(i) / (HIGH(i) - LOW(i)) + A/D(i-1)
meaning:
A/D(i) - Accumulation/Distribution indicator for the current bar;
CLOSE(i) – bar closing price;
LOW(i) – minimal bar price;
HIGH(i) – maximal bar price;
VOLUME(i) – volume;
A/D(i-1) - Accumulation/Distribution indicator for the previous bar.
The technical indicator Accumulation Distribution, A/D id determined by adjustment of price and volume. The volume appears to be a weighting index while price changing – the more big is the index (volume), the more significant will be the price correction influence on the indicator (for a certain period of time).

The InstaForex Analyst Team
GK InstaFintech © 2007-2025


