Top.Mail.Ru
empty
 
 
18.12.2024 02:37 PM
EUR/USD: December 18 – The FOMC Meeting Could Guide Traders
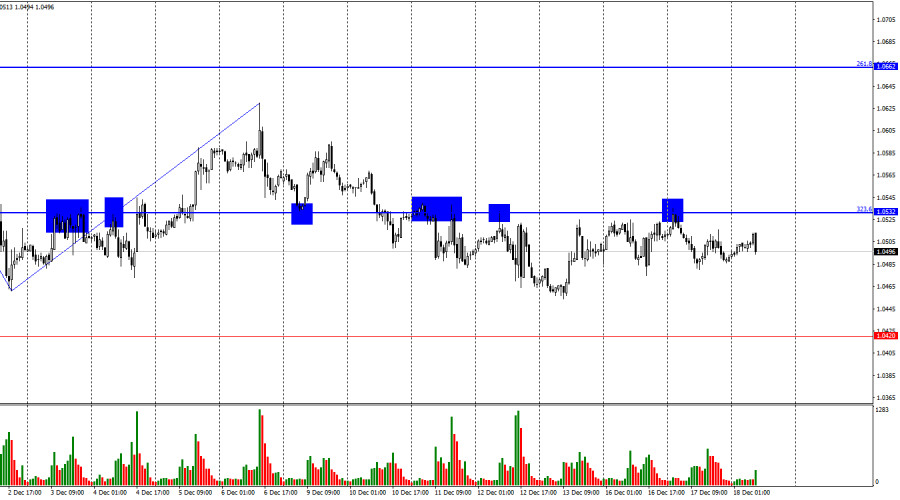
On Tuesday, the EUR/USD pair continued its horizontal trading below the 323.6% retracement level at 1.0532. A bearish sentiment persists under this level, but the market remains stagnant. A break above 1.0532 does not guarantee further growth for the euro, while a rebound from this level does not ensure a decline. The market is flat.

This image is no longer relevant

The wave structure is straightforward. The last completed downward wave failed to break the low of the previous wave, and the latest upward wave only slightly exceeded the prior peak. This indicates the pair has initiated a bullish trend, though it appears weak and may already be ending. To invalidate the current bullish trend, the pair must drop below the 1.0461 level.

Tuesday's fundamental backdrop was relatively weak, as reflected by the lack of movement in the market. None of the reports released influenced trader sentiment enough to disrupt the balance of forces. Today, traders can anticipate an end to the sideways movement as the results of the FOMC meeting are announced this evening. It is highly likely that the interest rate will be cut by another 0.25%. While this decision may have already been priced in, I still expect heightened trader activity. Increased activity could lead to stronger movements, potentially ending the flat trend. Jerome Powell's speech today could also affect trader sentiment. I anticipate Powell will once again discuss the gradual easing of monetary policy, which could support the US dollar. Additionally, the "dot-plot" graph outlining interest rate expectations for 2025–2026 will be crucial. It will indicate the rate changes expected by most Federal Reserve policymakers. These three events are poised to end the flat trend, although there is no guarantee that this will happen—it is merely a possibility.

This image is no longer relevant

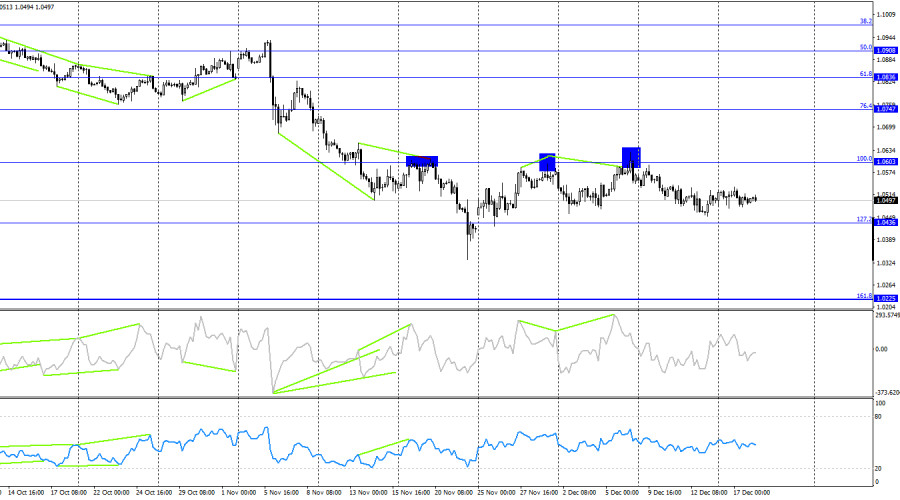
On the 4-hour chart, the pair made its second rebound from the 1.0603 retracement level and continues to decline toward the 127.2% Fibonacci level at 1.0436. A bearish divergence on the CCI indicator also pushes quotes downward. A rebound from the 1.0436 level could lead to some growth in the pair, while a close below this level would increase the likelihood of a further decline toward the next Fibonacci level at 1.0225.

Commitment of Traders (COT) Report

This image is no longer relevant

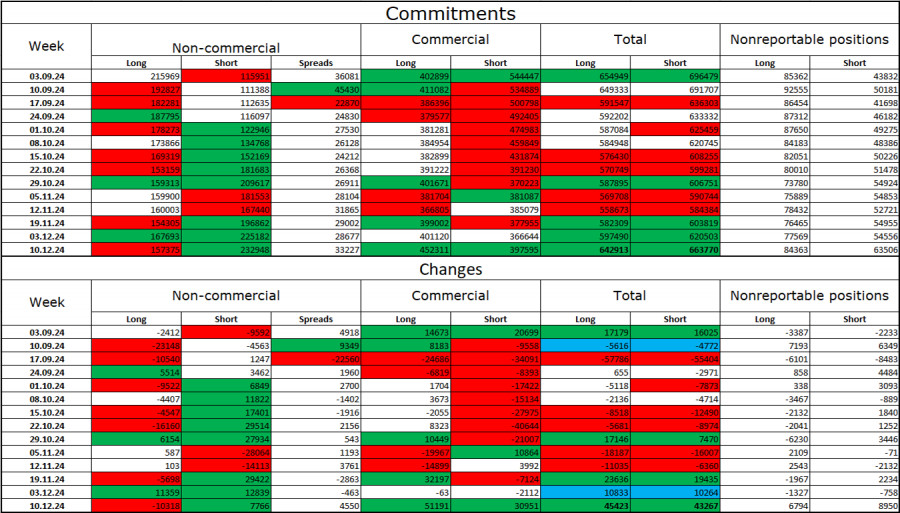
In the latest reporting week, speculators closed 10,318 long positions and opened 7,766 short positions. The sentiment among the "Non-commercial" group remains bearish and is strengthening, indicating a further decline in the pair. The total number of long positions held by speculators now stands at 157,000, compared to 233,000 short positions.

For thirteen consecutive weeks, major players have been offloading the euro. In my view, this signifies a bearish trend. The primary driver of dollar weakness—expectations of FOMC easing—has already been priced in. The market no longer has a compelling reason to sell the dollar. While such reasons could emerge over time, the rise of the US dollar still seems more likely. Technical analysis also points to the beginning of a long-term bearish trend. Therefore, I expect a prolonged decline in the EUR/USD pair.

News Calendar for the US and Eurozone

  • Eurozone: Consumer Price Index (10:00 UTC)
  • US: Building Permits (13:30 UTC)
  • US: Housing Starts (13:30 UTC)
  • US: FOMC Interest Rate Decision (19:00 UTC)
  • US: Dot-Plot Chart (19:00 UTC)
  • US: FOMC Press Conference (19:30 UTC)

December 18 includes several critical events in the economic calendar. The impact of this news on market sentiment is expected to be strong.

EUR/USD Forecast and Trading Advice

Short positions could have been opened following a rebound from the 1.0603 level on the 4-hour chart, targeting 1.0420 and 1.0320. These trades can remain open. Additionally, short positions are viable after rebounds from the 1.0532 level on the hourly chart. Long positions may become possible if the pair closes above 1.0532 on the hourly chart, though I would avoid risking long trades at this time.

Fibonacci levels were drawn between 1.1003–1.1214 on the hourly chart and 1.0603–1.1214 on the 4-hour chart.

Samir Klishi,
InstaForex के विश्लेषणात्मक विशेषज्ञ
© 2007-2024
Earn on cryptocurrency rate changes with InstaForex
Download MetaTrader 4 and open your first trade
  • Grand Choice
    Contest by
    InstaForex
    InstaForex always strives to help you
    fulfill your biggest dreams.
    कॉन्टेस्ट में हिस्सा लें
  • चैन्सी डिपॉजिट
    $ 3,000 के साथ अपना खाता जमा करें और प्राप्त करें $6000 अधिक!
    में दिसंबर हम आकर्षित करते हैं $6000 चैंसी डिपॉज़िट में
    ट्रेडिंग अकाउंट में $ 3,000 जमा करके जीतने का अवसर प्राप्त करें इस शर्त को पूरा करके आप प्रतियोगिता में भाग ले सकते हैं
    कॉन्टेस्ट में हिस्सा लें
  • ट्रेड वाइज़, विन डिवाइस
    कम से कम $500 के साथ अपने खाते में टॉप अप करें, कॉन्टेस्ट के लिए साइन अप करें और मोबाइल डिवाइस जीतने का मौका पाएं।
    कॉन्टेस्ट में हिस्सा लें
  • 100% बोनस
    अपनी जमा राशि पर 100% बोनस प्राप्त करने का आपका अनूठा अवसर
    बोनस पायें
  • 55% बोनस
    अपनी प्रत्येक डिपॉजिट पर 55% बोनस के लिए आवेदन करें
    बोनस पायें
  • 30% बोनस
    हर बार खाता टॉप अप करने पर 30% बोनस प्राप्त करें
    बोनस पायें

अनुशंसित लेख

अभी बात नहीं कर सकते?
अपना प्रश्न पूछें बातचीत.
Widget callback