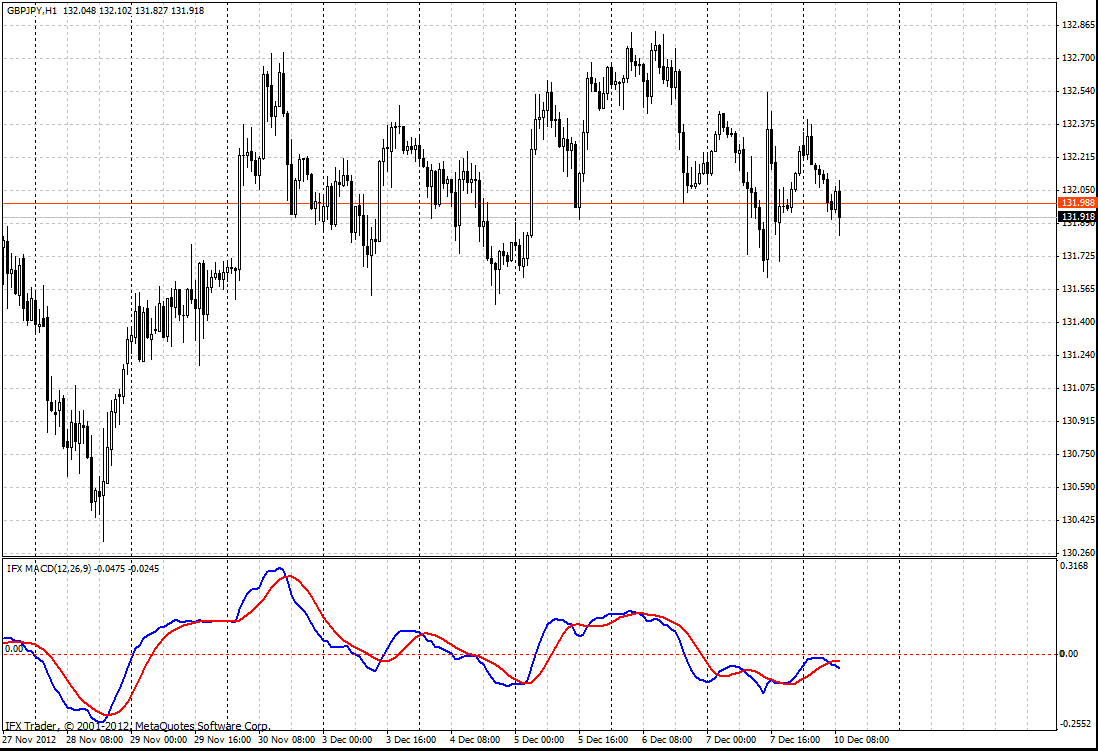
Developed by Gerald Appel in 1979, the Moving Average Convergence-Divergence (MACD) is a technical indicator, which was applied on commodity and stock markets. the MACD is an oscillator of technical analysis, which represents the first variant of later upgraded the MACD histogram. However, it is still appreciated by many traders as it is quite simple and has no significant noise when generating signals.
Formula
MACD = (ЕМАs(P) – EMAl(P)),
Signal = SМАa(ЕМАs(P) – EMAl(P)), where
ЕМАl(P) is the exponential moving average with long period from price;
EMAs(P) is the exponential moving average with short period from price;
SМАa(P) is the smoothed moving average with a short period from the difference of the rest moving averages;
P – closing price.
Trading use
The MACD is a classical market oscillator in the group of indicators performing identically within flat movement and trend movement. Compared with the Stochastic Oscillator, which is applied only when price moves sideways, the MACD is more multifunctional.
The main signal generated by the indicator is the MACD Line crossing Signal line. When the Signal line (red line) crosses the MACD line (blue line) upward it indicates a good moment for opening short-term positions. During the trend movement you should close deals within the reversed crossing of the lines.
The classical MACD indicator should not be relied upon when using convergence/divergence in your trading. For this purpose you should rather use the MACD histogram.
The most appropriate time frames for the MACD with standard (not optimized) settings are H4, Daily, Weekly.

InstaForex 3lineMacd Parameters
FastEMA = 12
SlowEMA = 26
SignalSMA = 9


