Analysis of Thursday's Trades:
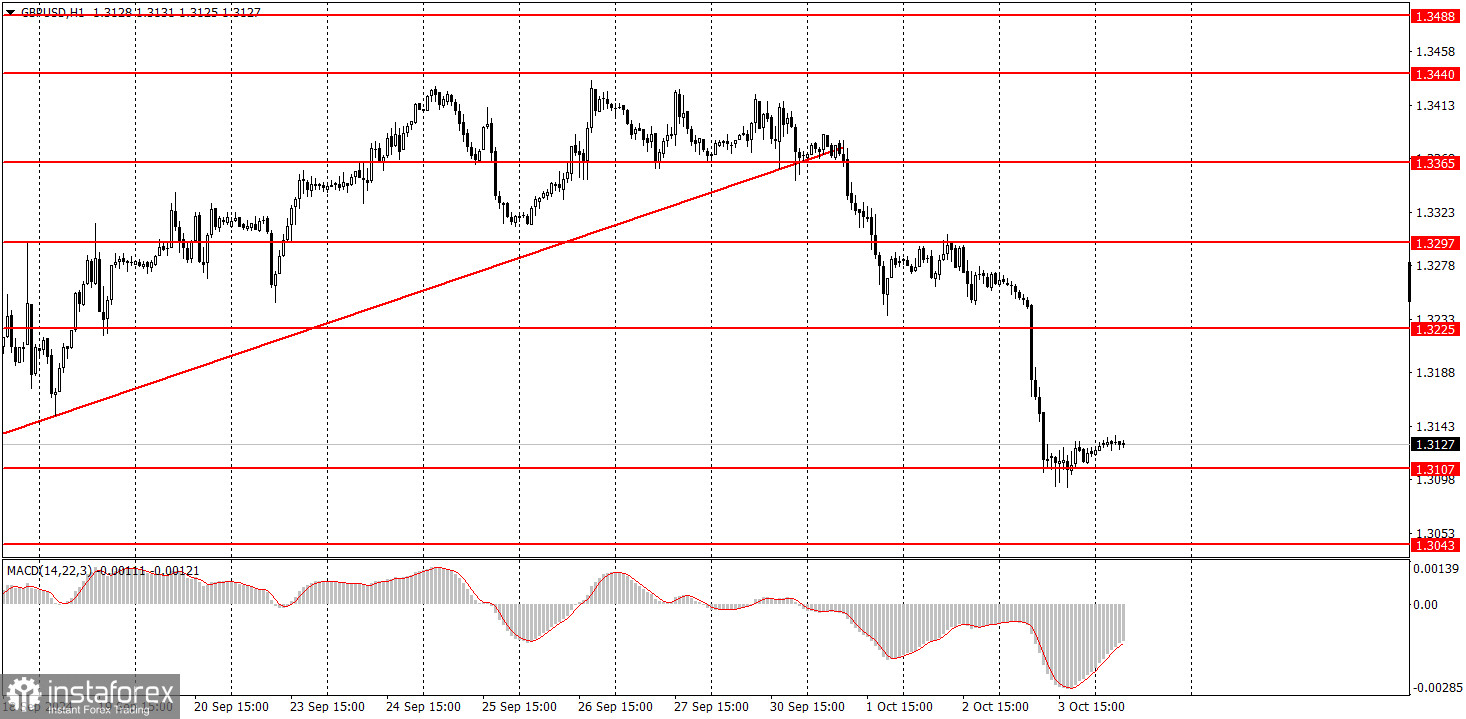
1H GBP/USD Chart:
On Thursday, the GBP/USD pair experienced a sharp drop for no significant local reasons. Of course, one could point to the weak services PMI from the UK, the strong ISM services PMI from the U.S., or Bank of England Governor Andrew Bailey's interview, where he mentioned that the pace of monetary policy easing could increase soon. However, none of these factors alone could justify the British currency dropping 150 pips in just a few hours. It's worth noting that the pair started falling even before the release of the indices.
As for Bailey, he didn't share any new or groundbreaking information. He merely reiterated that the BoE will lower rates more quickly if inflation declines. In our view, this is an expected outcome. However, the market has largely ignored the potential for rate cuts in the UK over the past few months. Therefore, the pound is currently falling due to overall overvaluation and the unjustifiable current exchange rate of the pair.
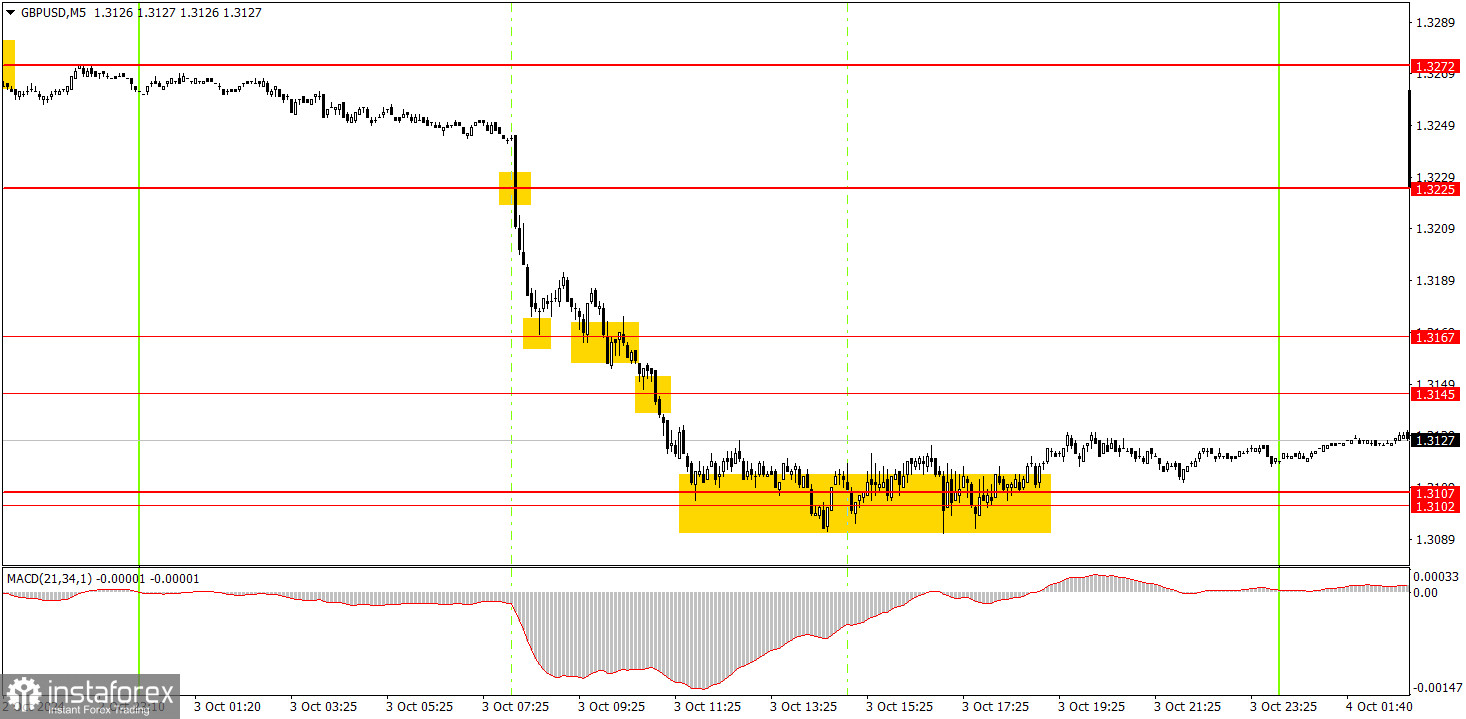
5M GBP/USD Chart:
In the 5-minute time frame, Thursday produced several good signals, as the movement was strong and trending. Novice traders could have opened short positions around the 1.3225 level. They could have exited short positions and opened long ones around 1.3167, but the buy signal was false. Later, there was a consolidation below the 1.3167 level, and traders could reopen short positions. Eventually, the price dropped to the 1.3102-1.3107 area, where profits should have been locked in.
How to Trade on Friday:
The GBP/USD pair has completed its upward trend in the hourly time frame. There are no issues with volatility right now, so traders can open trades within each trading day rather than just watching minimal movements that could be described as "convulsions." The U.S. dollar has finally started its long-awaited rise, but caution is advised when selling, especially considering the strong macroeconomic backdrop at the end of the week.
On Friday, the pound may continue its downward movement, with the 1.3102-1.3107 area, where the price rebounded yesterday, serving as a key reference point. An upward movement for the pair is also possible today if U.S. data come in weak.
In the 5-minute time frame, trades can be made based on the following levels: 1.2913, 1.2980-1.2993, 1.3043, 1.3102-1.3107, 1.3145-1.3167, 1.3225, 1.3272, 1.3365, 1.3428-1.3440, 1.3488, and 1.3537. No significant events are scheduled for Friday in the UK, but in the U.S., the most significant reports of the week — NonFarm Payrolls and the unemployment rate — will be released.
Basic Rules of the Trading System:
- The strength of a signal is determined by the time it takes for the signal to form (bounce or break through the level). The less time it takes, the stronger the signal.
- If two or more trades are opened around a certain level based on false signals, all subsequent signals from that level should be ignored.
- In a flat market, any pair can generate many false signals or none at all. In any case, at the first signs of a flat market, it is better to stop trading.
- Trading positions should be opened during the period from the start of the European session until the middle of the US session, after which all trades should be closed manually.
- In the hourly time frame, it is recommended to trade based on MACD indicator signals only when there is good volatility and a trend confirmed by a trendline or trend channel.
- If two levels are too close to each other (between 5 to 20 pips), they should be considered as a support or resistance zone.
- Upon passing 20 pips in the intended direction, a Stop Loss should be set at breakeven.
What's on the Charts:
Support and Resistance Price Levels: These levels serve as targets when opening buy or sell positions. They can also be used as points to set Take Profit levels.
Red Lines: These represent channels or trend lines that display the current trend and indicate the preferred trading direction.
MACD Indicator (14,22,3): The histogram and signal line serve as an auxiliary indicator that can also be used as a source of trading signals.
Important Speeches and Reports (always found in the news calendar) can significantly impact the movement of a currency pair. Therefore, trading should be done with maximum caution during their release, or you may choose to exit the market to avoid a sharp price reversal against the preceding movement.
For Beginners Trading on the Forex Market: It's essential to remember that not every trade will be profitable. Developing a clear strategy and practicing money management is key to achieving long-term success in trading.