Analysis of Wednesday's Trades
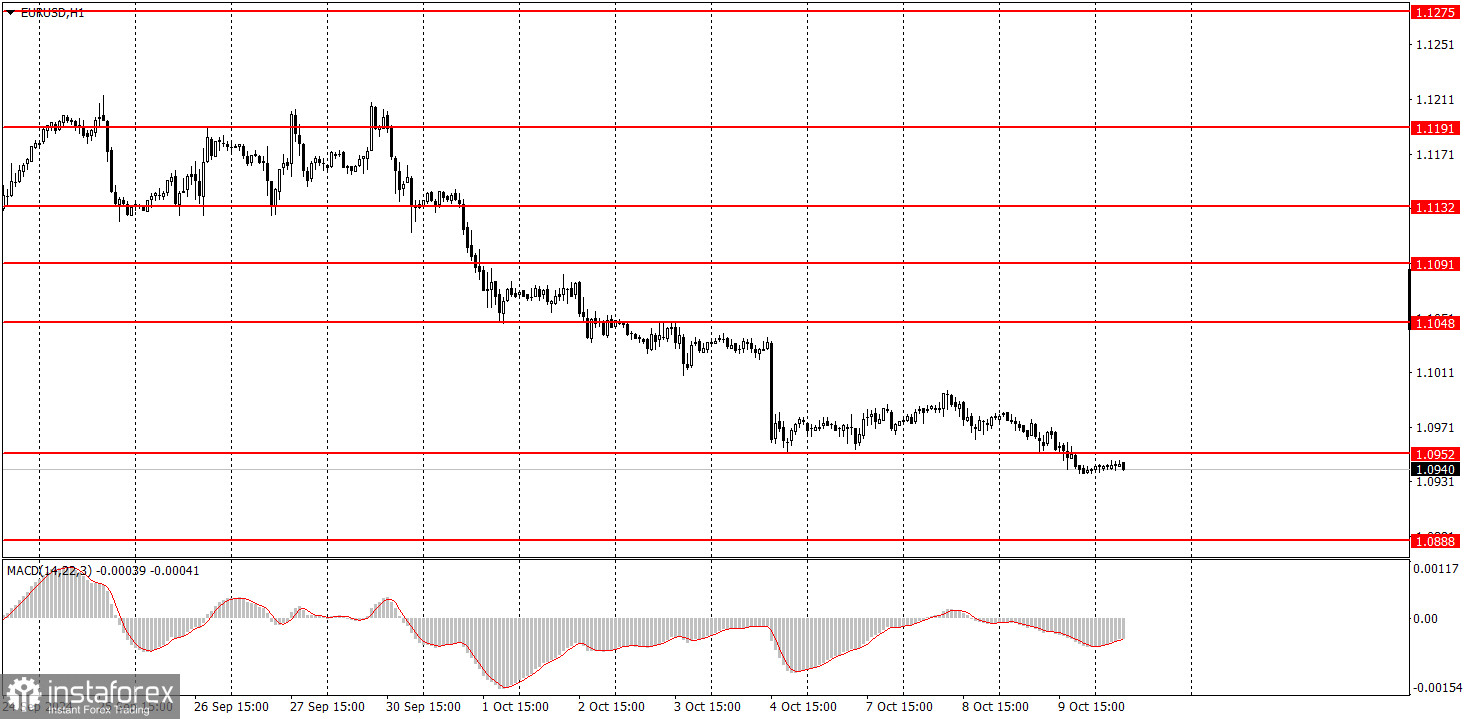
1H Chart of the EUR/USD Pair
The EUR/USD pair continued its downward movement on Wednesday despite no specific local reasons. Look closely at the illustration above—the price is simply drifting downward. This slow yet uninterrupted movement suggests that the US dollar is being purchased continuously, even without waiting for news. This means the market has settled into a medium-term buying mode for the US currency. At least, it will remain oriented toward a downtrend until a significant global event shifts overall market sentiment.
The euro continues its entirely justified decline while everyone expects a correction. For this reason, the price may continue to fall. Today, the US inflation report will be released, essentially the only important event scheduled for this week. Regardless of the report's actual data, we wouldn't be surprised if the market uses this report as an opportunity for further dollar purchases.
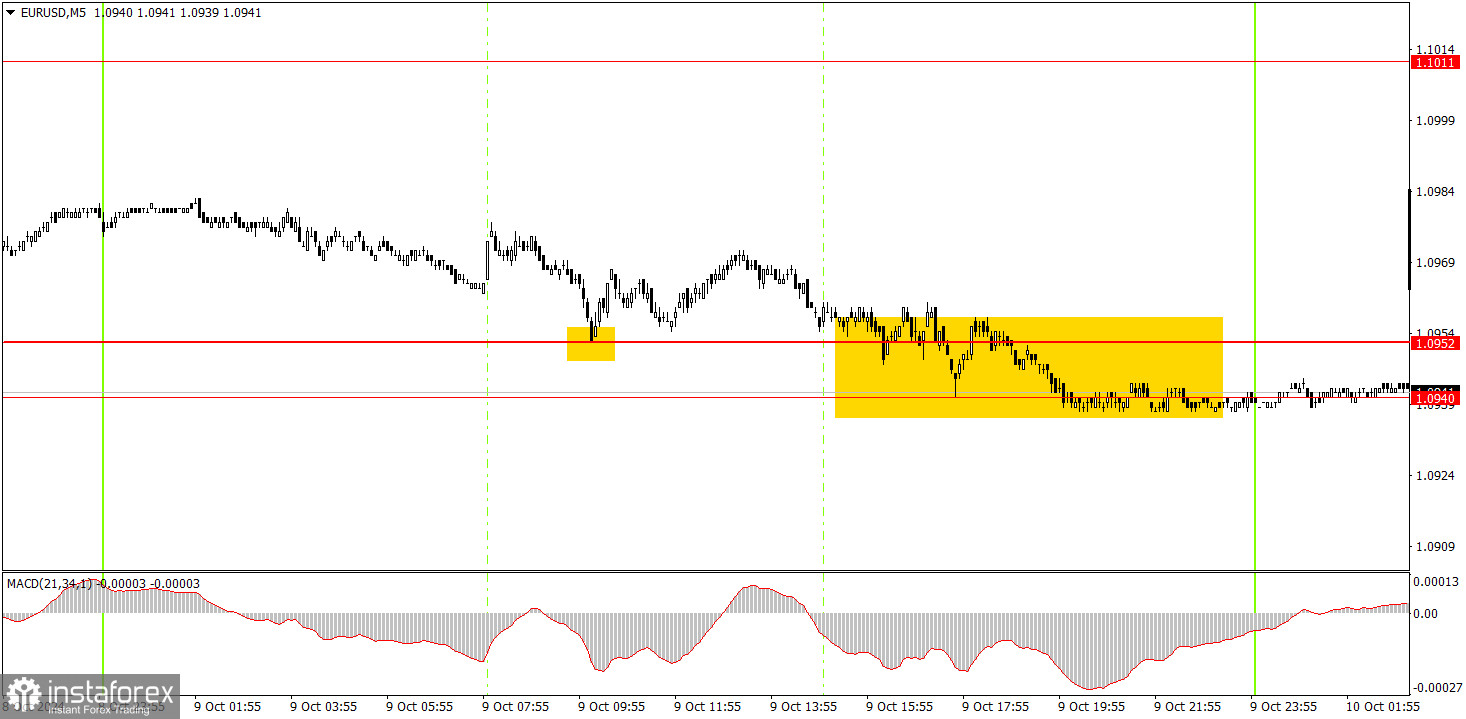
5M Chart of the EUR/USD Pair
Exactly one trading signal was formed in the 5-minute time frame on Wednesday. The price bounced off the 1.0952 level during the European trading session but managed to move up by no more than 15 pips. Therefore, this trade should have triggered a Stop Loss set to breakeven. A consolidation below the 1.0940 level would allow for continued selling of the pair with a target of 1.0888-1.0896.
How to Trade on Thursday:
In the hourly time frame, the EUR/USD pair made a significant move toward a new downtrend last week. Unfortunately, illogical dollar sales could resume in the medium term, as no one knows how much longer the market will adjust to the Federal Reserve's easing monetary policy. However, there is still a downtrend in the hourly time frame. After an upward correction (or even without one), further declines in the euro can be expected since it remains highly overbought.
On Thursday, trading can continue around the 1.0940-1.0951 area. The price has surpassed this area currently, but during the US session today, there may be a sharp upward movement due to the US inflation report.
In the 5-minute time frame, consider the levels of 1.0726-1.0733, 1.0797-1.0804, 1.0838-1.0856, 1.0888-1.0896, 1.0940-1.0951, 1.1011, 1.1048, 1.1091, 1.1132-1.1140, 1.1189-1.1191, and 1.1275-1.1292. No significant events or reports are planned in the Eurozone on Thursday, but the critical US inflation report will be released in the United States. Even if the data is neutral, the market may use it as an opportunity to open new positions.
Basic Rules of the Trading System:
- The strength of a signal is determined by the time it takes to form (bounce or break through a level). The less time it takes, the stronger the signal.
- If two or more trades were opened near a particular level based on false signals, all subsequent signals from that level should be ignored.
- In a flat market, any pair can generate a lot of false signals or none at all. In any case, it's best to stop trading at the first signs of a flat market.
- Trades should be opened during the period between the start of the European session and the middle of the US session, after which all trades should be manually closed.
- In the hourly time frame, it's preferable to trade based on MACD signals only when there is good volatility and a trend confirmed by a trendline or trend channel.
- If two levels are very close to each other (between 5 and 20 pips), they should be treated as a support or resistance zone.
- When moving 15 pips in the intended direction, a Stop Loss should be set to breakeven.
What's on the Charts:
Support and Resistance Price Levels: These levels serve as targets when opening buy or sell positions. They can also be used as points to set Take Profit levels.
Red Lines: These represent channels or trend lines that display the current trend and indicate the preferred trading direction.
MACD Indicator (14,22,3): The histogram and signal line serve as an auxiliary indicator that can also be used as a source of trading signals.
Important Speeches and Reports (always found in the news calendar) can significantly impact the movement of a currency pair. Therefore, trading should be done with maximum caution during their release, or you may choose to exit the market to avoid a sharp price reversal against the preceding movement.
For Beginners Trading on the Forex Market: It's essential to remember that not every trade will be profitable. Developing a clear strategy and practicing money management is key to achieving long-term success in trading.