EUR/USD 5M Analysis:
On Friday, the EUR/USD pair continued to trade with minimal volatility, maintaining its downward trend. Throughout last week, market activity was close to zero, making trading particularly challenging. The macroeconomic environment was weak, and none of the reports, apart from those related to inflation, triggered any significant market reaction. Even on Friday, the release of the Producer Price Index (PPI) and Consumer Sentiment Index, which are moderately important for the market, failed to cause much movement. The overall volatility for the day was no more than 30 points, essentially indicating a lack of significant price movement.
From a technical perspective, the euro remains on a downward path, even though we expected a correction last week. However, the price has yet to consolidate above the critical line, so no correction has occurred. This week, the ECB meeting could act as a catalyst for market movements. Since the ECB is likely to lower rates for the third time, many expect another drop in the euro. However, it's likely that the market has already priced in this decision, making a rise in the pair a reasonable expectation. We will need to await clear technical signals to confirm this.
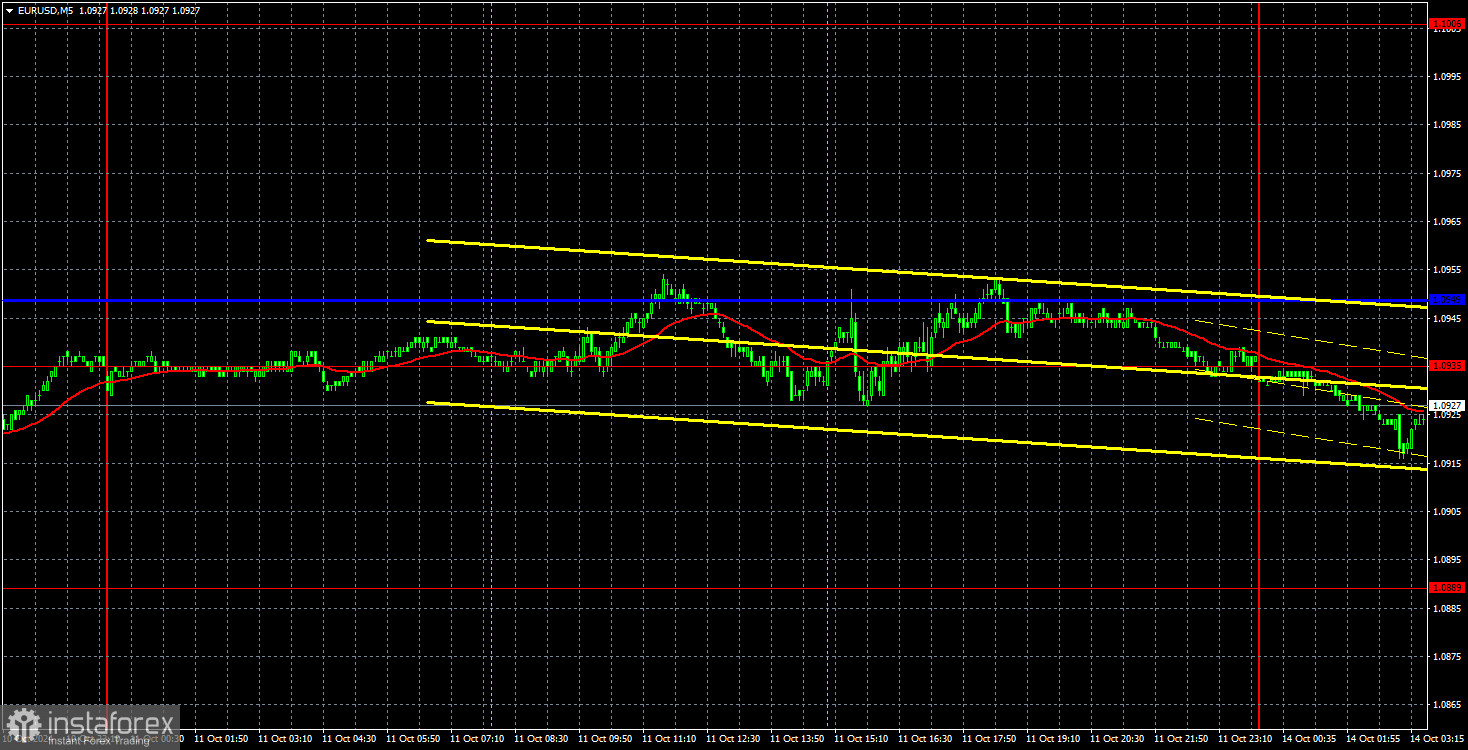
On the 5-minute timeframe, trading on Friday was impractical. The pair remained in a low-volatility flat range throughout the day, ignoring all significant levels and lines. Even if we had traded a good signal, what profit could be expected from a movement of just 30 points? Therefore, we must wait for a significant market movement, which could occur suddenly and unexpectedly—but is unlikely today.
COT Report:
The latest COT report is dated October 1. The chart above clearly shows that the net position of non-commercial traders has remained "bullish" for a long time. The bears' attempt to gain dominance failed spectacularly. The net position of non-commercial traders (the red line) decreased in the second half of 2023 and early 2024, while the commercial position (the blue line) increased. Professional traders are once again increasing their long positions.
We still don't see any fundamental reasons for the euro to strengthen, and technical analysis indicates that the price is in a consolidation zone, essentially flat. On the weekly chart, it's clear that since December 2022, the pair has been trading between 1.0448 and 1.1274. This means the pair has transitioned from a seven-month flat market into an 18-month one.
Currently, the red and blue lines are diverging, indicating an increase in long positions on the euro. However, within the context of a flat market, these changes do not provide a basis for long-term conclusions. During the last reporting week, the number of long positions in the "Non-commercial" group decreased by 9.5 thousand, while the number of short positions increased by 6.8 thousand. Accordingly, the net position fell by 16.3 thousand. The euro still has significant potential for decline.
EUR/USD 1H Analysis:
In the hourly timeframe, the pair still has a real chance to end the baseless upward trend that has been ongoing for two years. There's no point in discussing fundamental or macroeconomic reasons for a potential new decline in the dollar—they simply don't exist. Technical analysis has also shifted in favor of a downward direction. Of course, the two-year upward trend may continue for some time due to inertia, but in the medium term, we expect nothing but a decline. In the short term, we anticipate a correction.
On October 14, the following levels are highlighted for trading: 1.0658-1.0669, 1.0757, 1.0797, 1.0843, 1.0889, 1.0935, 1.1006, 1.1092, 1.1147, 1.1185, 1.1234, 1.1274, along with the Senkou Span B line (1.1083) and Kijun-sen line (1.0949). The Ichimoku indicator lines may move during the day, which should be considered when identifying trading signals. It is advisable to place a Stop Loss at breakeven if the price moves 15 points in the right direction. This will help prevent potential losses if the signal turns out to be false.
On Monday, no significant events or even secondary ones are scheduled in the Eurozone or the U.S. Thus, we shouldn't expect an increase in volatility or any trend movements during the day.
Explanation of the illustrations:
- Support and resistance levels (resistance/support): Thick red lines, where the movement may end. They are not sources of trading signals.
- Kijun-sen and Senkou Span B lines: Ichimoku indicator lines, transferred to the hourly timeframe from the 4-hour chart. They are strong lines.
- Extreme levels: Thin red lines, from which the price has previously bounced. These are sources of trading signals.
- Yellow lines: Trend lines, trend channels, and any other technical patterns.
- Indicator 1 on the COT charts: Shows the size of the net position of each category of traders.