Analysis of GBP/USD 5M
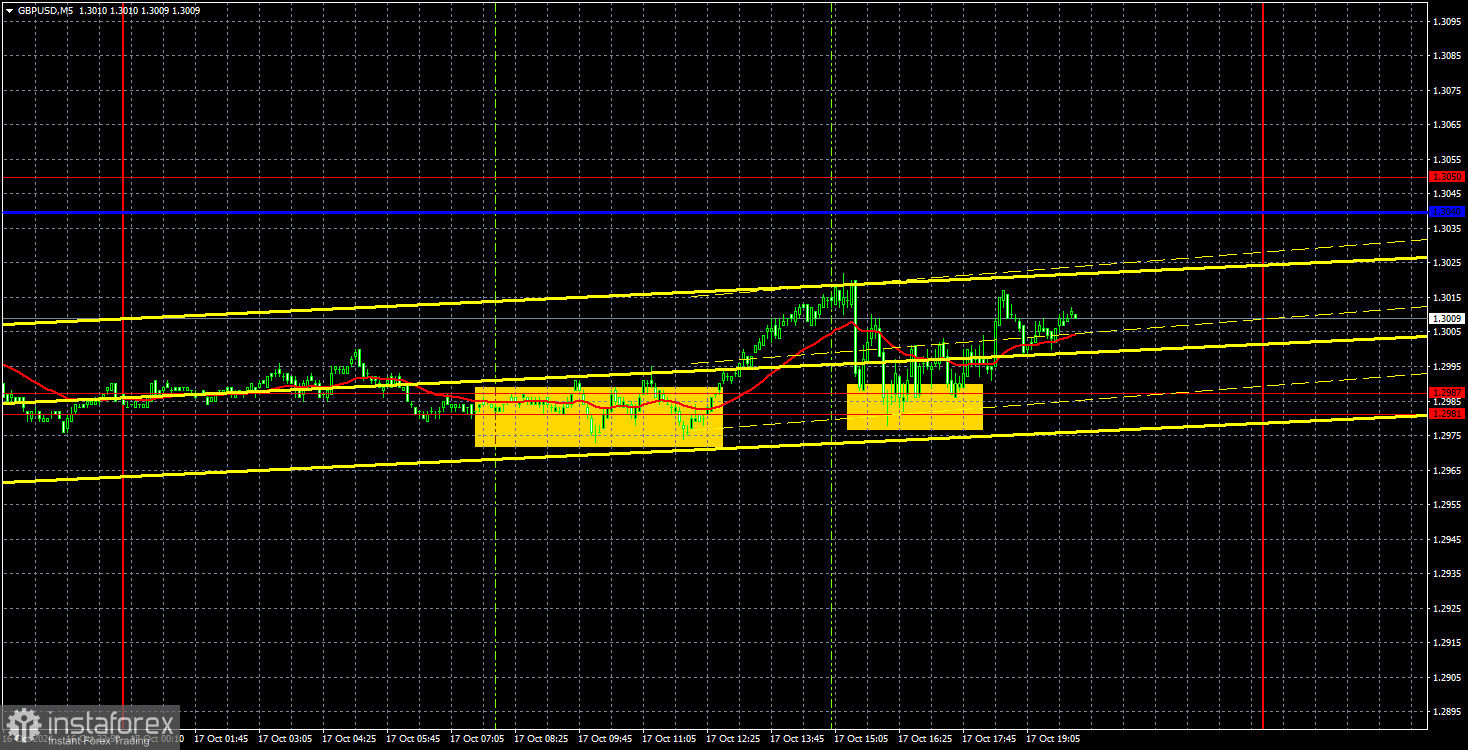
The GBP/USD currency pair attempted again on Thursday to move below its current levels, but this time, it was unsuccessful. It's not that the pound sterling rose significantly throughout the day; it simply stalled around the 1.30 level. This level is psychological, so the price may trade around it for some time. At the same time, the price remains below the critical line and the trendline, meaning there are no signals for a possible correction. The pound is currently experiencing the same problem as the euro—it has been rising for too long, too sharply, and without solid justification. It can decline daily because it remains unjustifiably expensive relative to the U.S. dollar. Therefore, we expect to see the pound much lower than the 1.30 level.
Yesterday, there were no significant events in the UK, while in the U.S., industrial production was worse than expected, retail sales were better, and jobless claims were lower than forecasts. Overall, this set of U.S. data could be considered positive for the dollar. If so, the pound's temporary rise against the dollar is unrelated to these reports—it all comes down to the 1.30 level.
On Thursday, two buy signals formed around the 1.2981-1.2987 area. Traders could have opened long positions in both instances, with the price struggling to move in the intended direction by 20-25 pips. Volatility remains very low, which should be taken into account. And in any case, the pound is inclined toward falling rather than rising.
COT Report:
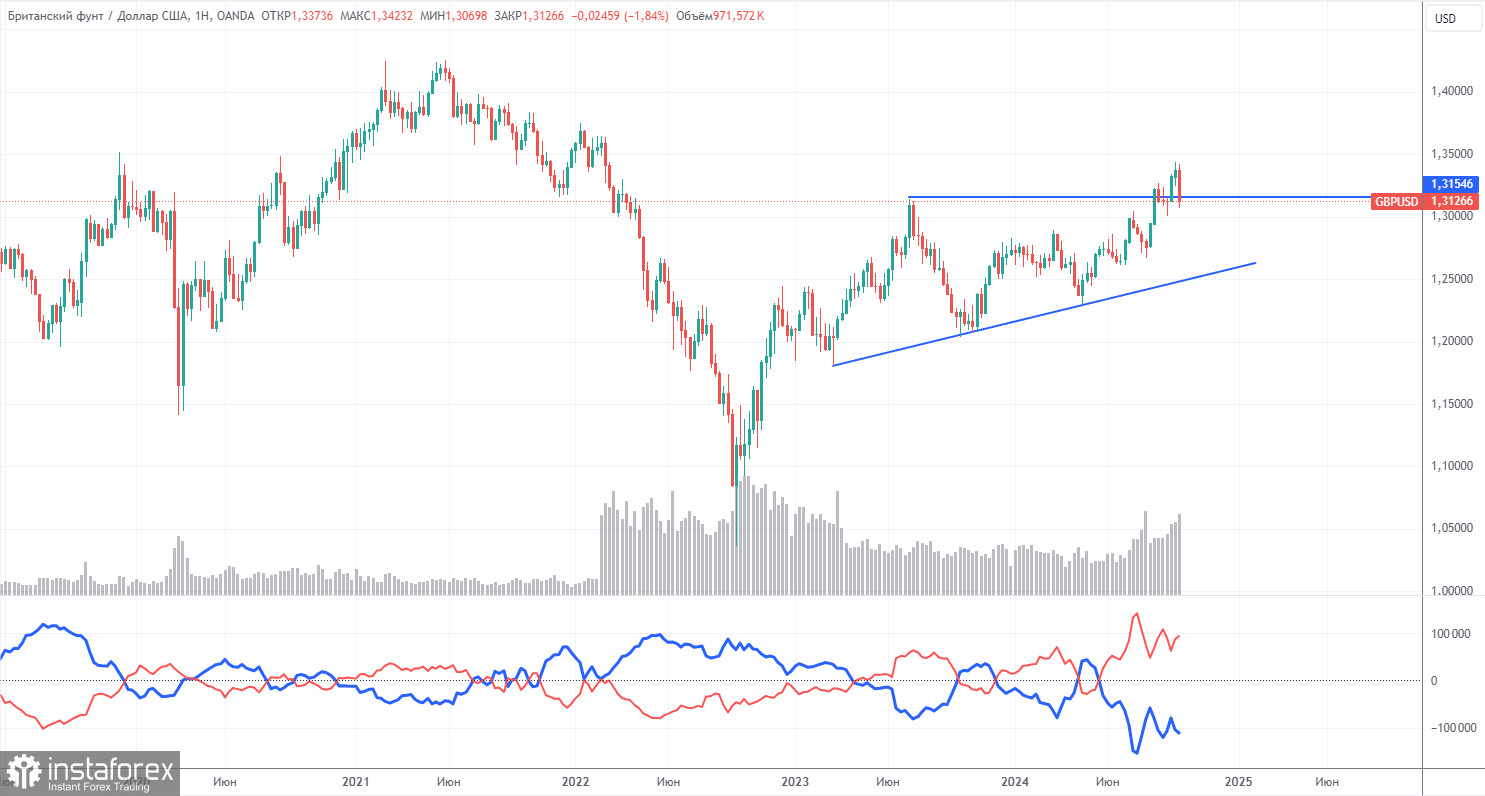
The COT (Commitment of Traders) reports for the British pound show that commercial traders' sentiment has been constantly changing over recent years. The red and blue lines, representing the net positions of commercial and non-commercial traders, frequently cross and are primarily near the zero mark. We also see that the latest downward trend occurred when the red line was below the zero mark. The red line is above zero, and the price has broken through the important 1.3154 level.
According to the latest COT report on the British pound, the non-commercial group opened 6,100 new BUY contracts and closed 600 SELL contracts. As a result, the net position of non-commercial traders increased by 6,700 contracts over the week. The British pound continues to be bought up by market participants...
The fundamental backdrop still does not justify long-term purchases of the British pound, and the currency has a real chance of resuming a global downward trend. However, on the weekly time frame, we have an ascending trend line, so until it is broken, we cannot expect a long-term decline in the pound. The pound has been rising despite almost everything, and even when COT reports show that large players are selling it, it still rises.
Analysis of GBP/USD 1H
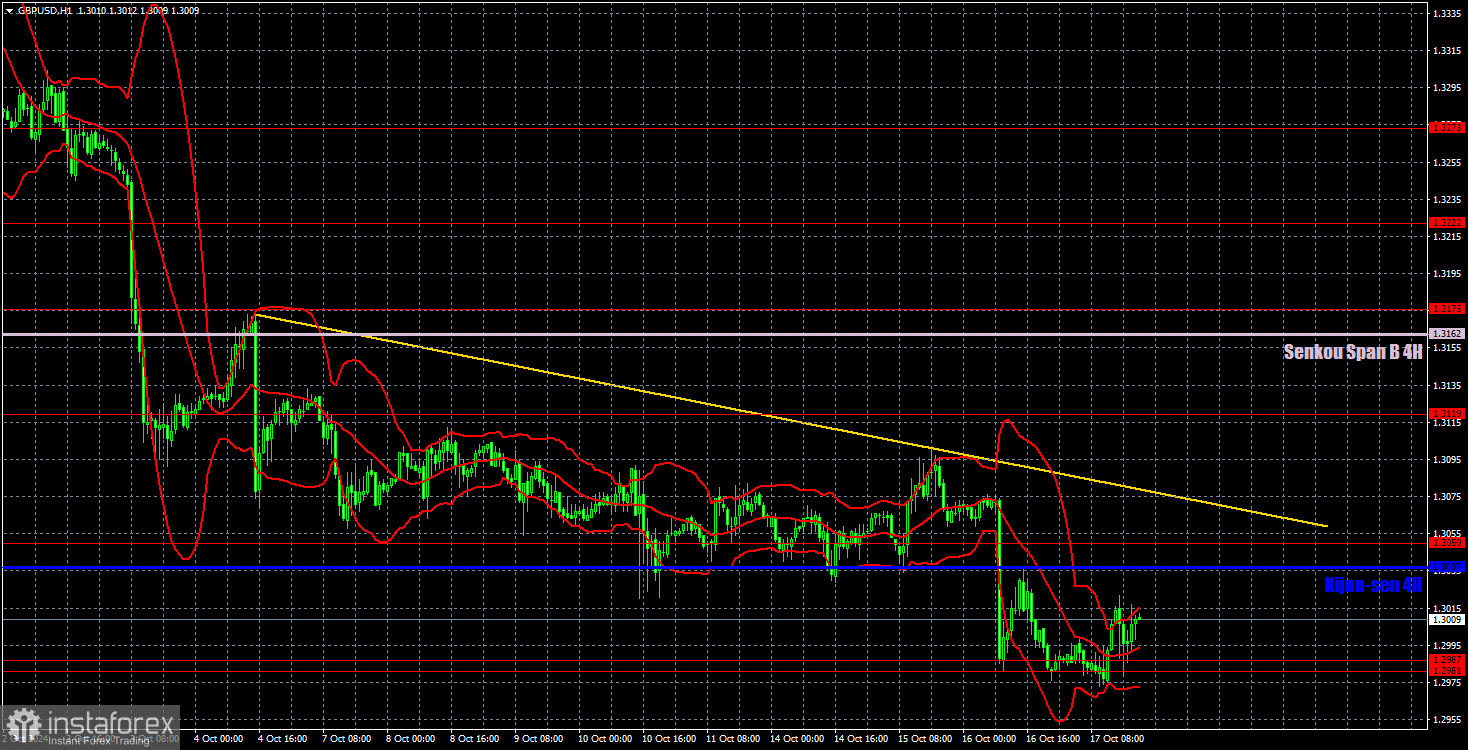
The GBP/USD pair continues to decline in the hourly time frame. The uptrend has been canceled, so further declines in the British currency are to be expected, and they could be strong and prolonged. Of course, the market could resume unjustified purchases of the British currency, but let's reiterate—there are no fundamental or macroeconomic reasons for this. Therefore, as before, we only favor downward movement, although the pair could see a short-term upward correction. For this to happen, the price must at least consolidate above the trendline.
For October 18, we highlight the following key levels: 1.2796-1.2816, 1.2863, 1.2981-1.2987, 1.3050, 1.3119, 1.3175, 1.3222, 1.3273, 1.3367, and 1.3439. The Senkou Span B (1.3162) and Kijun-sen (1.3037) lines may also serve as signal sources. It is recommended to place a Stop Loss at break even if the price moves 20 pips in the intended direction. The Ichimoku indicator lines can shift during the day, which should be considered when determining trading signals.
On Friday, the UK will release its retail sales report, while no significant events are expected in the U.S. It is unlikely that the market will be able to break through the 1.2981-1.2987 area on the last trading day of the week. Nevertheless, as before, traders should be prepared for a downward move.
Explanation of Illustrations:
Support and Resistance Levels: Thick red lines near which price movement may end. They are not sources of trading signals.
Kijun-sen and Senkou Span B Lines: Ichimoku indicator lines transferred to the hourly time frame from the 4-hour chart. They are strong lines.
Extremes Levels: Thin red lines from which the price has previously bounced. They serve as sources of trading signals.
Yellow Lines: Trend lines, trend channels, and any other technical patterns.
Indicator 1 on COT charts: The size of the net position for each category of traders.