empty
 
 
21.10.2024 01:14 PM
Forecast for EUR/USD on October 21, 2024

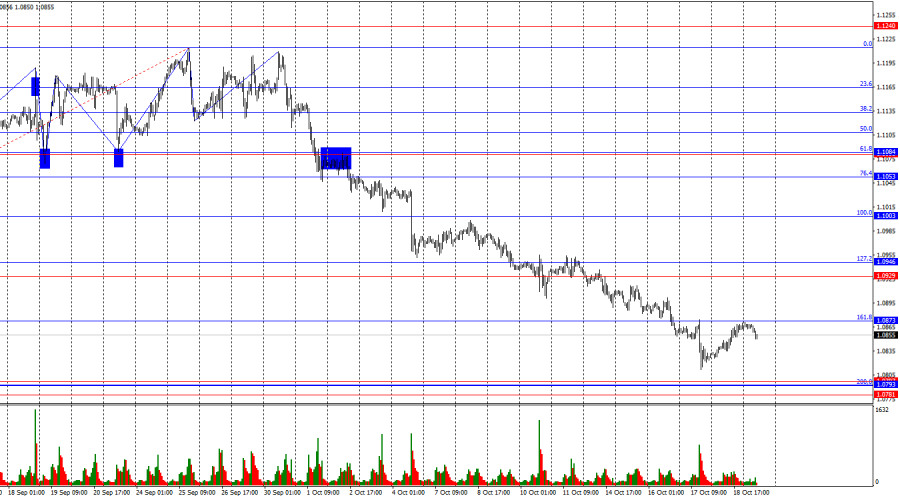
On Friday, the EUR/USD pair returned to the 1.0873 level, which corresponds to a corrective level of 161.8%. Today, a rebound from this level suggests a potential new reversal in favor of the U.S. dollar and a renewed decline towards the support zone of 1.0781–1.0797, which includes the 200.0% Fibonacci level at 1.0793. If the pair consolidates above 1.0873, the euro could rise further towards 1.0929.

This image is no longer relevant

The wave structure is clear. The last completed upward wave (September 25-30) did not surpass the peak of the previous wave, while the new downward wave (still forming) has broken the lows of the previous three waves. Thus, the pair appears to be forming a new "bearish" trend. A corrective wave may appear soon, but the bulls have lost their momentum. Regaining it would require a significant effort, which is unlikely to happen in the near future.

The news background on Friday was very weak and is expected to remain the same this week. There will be multiple speeches from FOMC and ECB members throughout the week, but it may not be necessary to analyze every statement from each official in detail. In my view, the market is currently focused on key themes, with other news playing a secondary role. For instance, what impact can business activity indices have this week? Likely a very weak one. Christine Lagarde will deliver three speeches over the first few days, but the ECB meeting was just last week, and it is unlikely her rhetoric will change significantly since last Thursday—if she even addresses monetary policy. In the US, the situation is no better, with the only notable report being the durable goods orders, set for release on Friday. At the moment, I see no reasons for the euro to show growth. Consolidation above 1.0873 could provide support for further growth, but the bulls must first surpass this level.

This image is no longer relevant

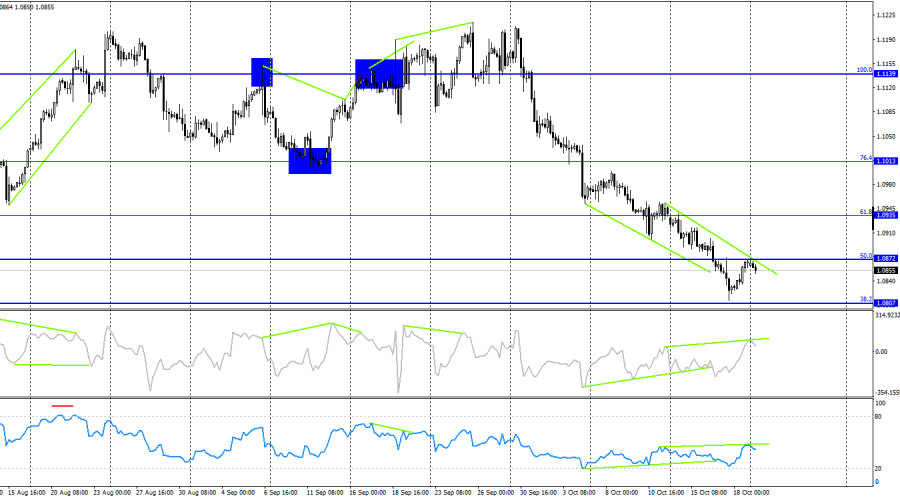
On the 4-hour chart, the pair continues to decline towards the 38.2% Fibonacci level at 1.0807. For over a week, "bullish" divergences have been forming on both indicators. However, they only suggest the possibility of a correction, as the trend has shifted to "bearish." So far, traders have ignored these signals. Simultaneously, "bearish" divergences have appeared, which hold more weight in a "bearish" trend. A rebound from the 1.0807 level would favor the euro and support a slight rise towards 1.0872 and 1.0935.

Commitments of Traders (COT) Report

This image is no longer relevant

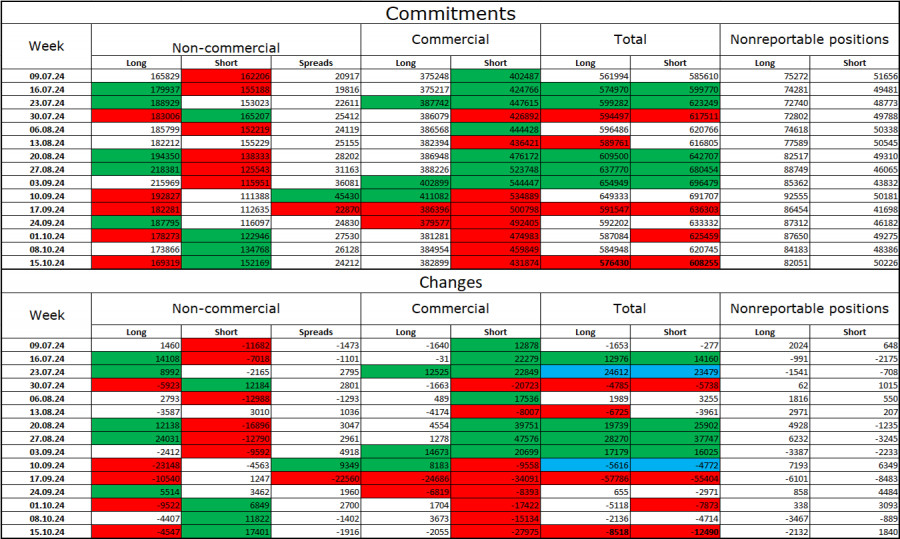
During the last reporting week, speculators closed 4,547 long positions and opened 17,401 short positions. The sentiment of the "Non-commercial" group turned "bearish" a few months ago, but bulls currently dominate. However, their momentum weakens with each passing week. The total number of long positions held by speculators now stands at 169,000, while short positions amount to 152,000.

For six consecutive weeks, large players have been reducing their holdings of the euro. In my view, this could signal a new "bearish" trend or at least a strong correction. The key factor behind the dollar's decline—expectations of FOMC monetary easing—has already been reflected in the market, and there is currently no reason to continue abandoning the dollar. New reasons may arise over time, but for now, further growth of the US dollar is more likely. Technical analysis also points to the onset of a "bearish" trend, which is why I am preparing for a prolonged decline in the EUR/USD pair.

News Calendar for the US and Eurozone:

The economic events calendar for October 21 is empty, so the impact of the news background on market sentiment will be absent today.

Forecast for EUR/USD and Trading Tips:

Selling opportunities emerged when the pair closed below the 1.1139 level on the 4-hour chart, with targets at 1.1081, 1.1070, 1.1013, and 1.0984—all of which were achieved. Further selling could have been considered after consolidating below 1.0873 (or after a rebound from this level), targeting 1.0797. I would only consider buying the pair after a rebound from the 1.0797 level, as it could indicate a potential upward correction.

Fibonacci Levels:

Levels are plotted between 1.1003–1.1214 on the hourly chart and between 1.1139–1.0603 on the 4-hour chart.

Samir Klishi,
انسٹافاریکس کا تجزیاتی ماہر
© 2007-2024
انسٹافاریکس کے ساتھ کرپٹو کرنسی کی معاملاتی تبدیلیوں سے کمائیں۔
میٹا ٹریڈر 4 ڈاؤن لوڈ کریں اور اپنی پہلی ٹریڈ کھولیں۔
  • Grand Choice
    Contest by
    InstaForex
    InstaForex always strives to help you
    fulfill your biggest dreams.
    مقابلہ میں شامل ہوں
  • چانسی ڈیپازٹ
    اپنے اکاؤنٹ میں 3000 ڈالر جمع کروائیں اور حاصل کریں$1000 مزید!
    ہم اکتوبر قرعہ اندازی کرتے ہیں $1000چانسی ڈیپازٹ نامی مقابلہ کے تحت
    اپنے اکاؤنٹ میں 3000 ڈالر جمع کروانے پر موقع حاصل کریں - اس شرط پر پورا اُترتے ہوئے اس مقابلہ میں شرکت کریں
    مقابلہ میں شامل ہوں
  • ٹریڈ وائز، ون ڈیوائس
    کم از کم 500 ڈالر کے ساتھ اپنے اکاؤنٹ کو ٹاپ اپ کریں، مقابلے کے لیے سائن اپ کریں، اور موبائل ڈیوائسز جیتنے کا موقع حاصل کریں۔
    مقابلہ میں شامل ہوں
  • 100 فیصد بونس
    اپنے ڈپازٹ پر 100 فیصد بونس حاصل کرنے کا آپ کا منفرد موقع
    بونس حاصل کریں
  • 55 فیصد بونس
    اپنے ہر ڈپازٹ پر 55 فیصد بونس کے لیے درخواست دیں
    بونس حاصل کریں
  • 30 فیصد بونس
    ہر بار جب آپ اپنا اکاؤنٹ ٹاپ اپ کریں تو 30 فیصد بونس حاصل کریں
    بونس حاصل کریں

تجویز کردہ مضامین

ابھی فوری بات نہیں کرسکتے ؟
اپنا سوال پوچھیں بذریعہ چیٹ.
Widget callback