EUR/USD 5-Minute Analysis
The EUR/USD currency pair continued its weak upward movement on Wednesday, despite a lack of fundamental reasons for the euro to rise again. While one might speculate that the dollar's decline on Monday and Tuesday was influenced by Trump's statements about tariffs, the U.S. president made no significant announcements on Wednesday to reinforce that narrative. This suggests that the current increase in the pair is purely technical in nature.
The only noteworthy event of the day was a speech by Christine Lagarde, the President of the European Central Bank (ECB). She stated that inflation is expected to stabilize at 2% by 2025 and expressed her willingness to continue easing monetary policy. Additionally, Lagarde mentioned that the European Union must prepare for a potential trade war with the U.S. However, she did not provide any new or particularly significant information, resulting in minimal market reaction.
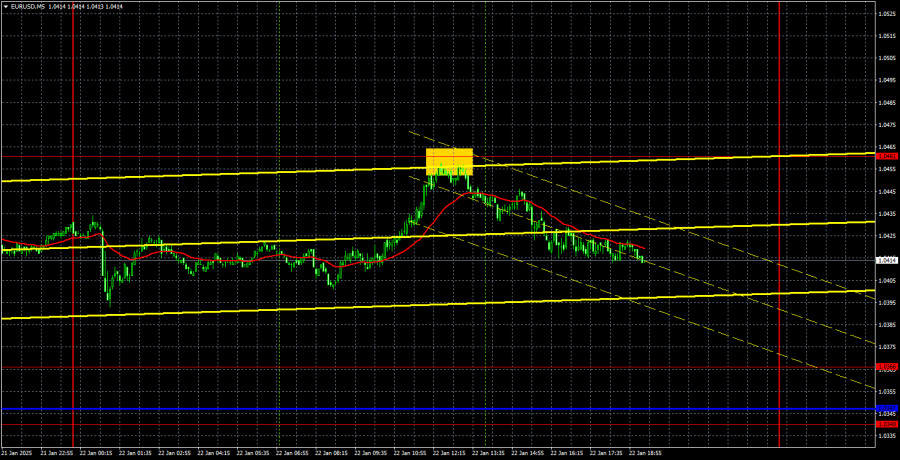
On the 5-minute TF, exactly one trading signal was formed on Wednesday. The pair rebounded from the level of 1.0461 with a small error during the European trading session, and managed to go down about 30 pips by the end. No other signals were formed during the day.
COT Report
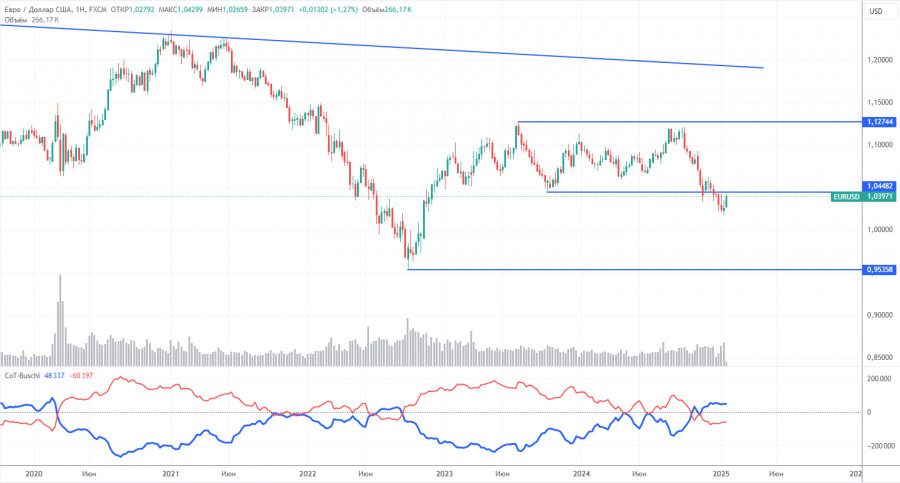
The latest COT report, dated January 14, indicates that the net position of non-commercial traders has consistently leaned towards a bullish stance. However, bears have recently taken the lead. Two months ago, there was a significant increase in the number of open short positions held by professional traders, resulting in a net position that turned negative for the first time in a considerable period. This suggests that the euro is being sold more frequently than it is being purchased.
Currently, we do not observe any fundamental factors that could support a strengthening of the euro. Technical analysis consistently shows that the price has remained in a consolidation zone, essentially demonstrating a flat trend. On the weekly timeframe, it is evident that since December 2022, the pair has fluctuated between the levels of 1.0448 and 1.1274. However, breaking below the 1.0448 level has opened up new opportunities for further decline.
At present, the red and blue lines have crossed and reversed their positions concerning each other, signaling a bearish trend in the market. During the last reporting week, the number of long positions in the "Non-commercial" category decreased by 3,700 contracts, while short positions dropped by 7,400 contracts. Consequently, the net position increased slightly by 3,700 contracts.
EUR/USD 1-Hour Analysis
On the hourly timeframe, the currency pair has started a new upward trend, although this trend is still corrective. In the medium term, we anticipate that the euro will continue to decline. The Federal Reserve is expected to reduce interest rates only 1-2 times in 2025, which indicates a much more hawkish stance than the market had previously anticipated. This, among other factors, will generally support the U.S. dollar. The end of the technical correction can be identified when the price consolidates below the Ichimoku indicator lines and the trend line.
For January 23, the following trading levels are highlighted: 1.0124, 1.0195, 1.0269, 1.0340-1.0366, 1.0461, 1.0524, 1.0585, 1.0658-1.0669, 1.0757, 1.0797, and 1.0843, along with the Senkou Span B line at 1.0308 and the Kijun-sen line at 1.0359. Please note that Ichimoku indicator lines may shift throughout the day, so this should be considered when determining trading signals. Remember to place Stop Loss orders at break-even when the price moves 15 pips in the desired direction to minimize the risk of potential losses if the signal turns out to be false.
On Thursday, there are no significant reports scheduled in either the Eurozone or the U.S. The only event of the day is the U.S. jobless claims report, which is of secondary importance. As a result, we expect very calm market movements today.
Illustration Explanations:
- Support and Resistance Levels (thick red lines): Thick red lines indicate where movement may come to an end. Please note that these lines are not sources of trading signals.
- Kijun-sen and Senkou Span B Lines: Ichimoku indicator lines transferred from the 4-hour timeframe to the hourly timeframe. These are strong lines.
- Extreme Levels (thin red lines): Thin red lines where the price has previously bounced. These serve as sources of trading signals.
- Yellow Lines: Trendlines, trend channels, or any other technical patterns.
- Indicator 1 on COT Charts: Represents the net position size for each category of traders.


