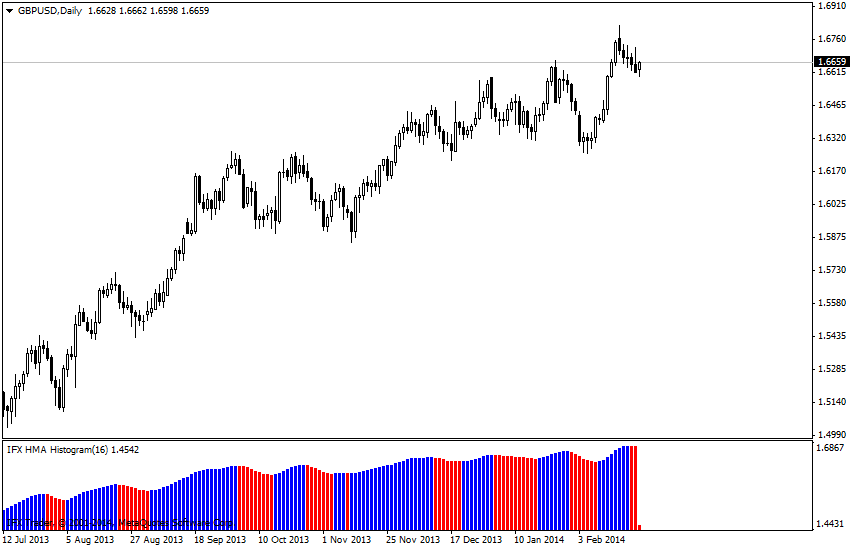
The HMA_histogram indicator is a version of classical HMA indicator by Alan Hull in the form of histogram similar to the one of the MACD indicator.
Formula
HMA(n) = WMA(2*WMA(n/2) – WMA(n)), sqrt(n))
Trading use
The HMA_histogram is a trend indicator in the shape of histogram, bars of which indicate price movement direction (a blue bar points to rising, a red one suggests a fall) and entry points to the market.
If there is a general ascendant trend on the market, and the HMA_histogram has changed the color to blue from red, it is time to buy an asset as the price can rise further within the overall uptrend. The change of color is a signal to enter the market.
When there is a downtrend in the market and the HMA_histogram has turned red, we should sell an asset as the price can fall lower within the overall descending trend. When the indicator is changing the color, it is a signal for entry.
A special characteristic of this indicator is that it not only smoothes price changes but also allows you to exclude the lagging of signals. It became possible due to the particular formula. Thus, a trader may use this indicator in trading and be sure that the HMA_histogram will not give a lagging signal to buy or sell.
The HMA_histogram can be applied as a filter for entry to the market; in this case trades can be opened based on other indicators and analyses. The histogram can help you to determine the best time to close a deal: when the indicator changes the color to opposite one, an open trade in the direction of a price movement should be closed. Then, wait for next signal to enter the market.


