Top.Mail.Ru
empty
07.12.2021 05:16 PM
Trading signal for CRUDE OIL (WTI- #CL) on December 07 - 08, 2021: buy in case of rebound off 68.13 (21 SMA)

This image is no longer relevant

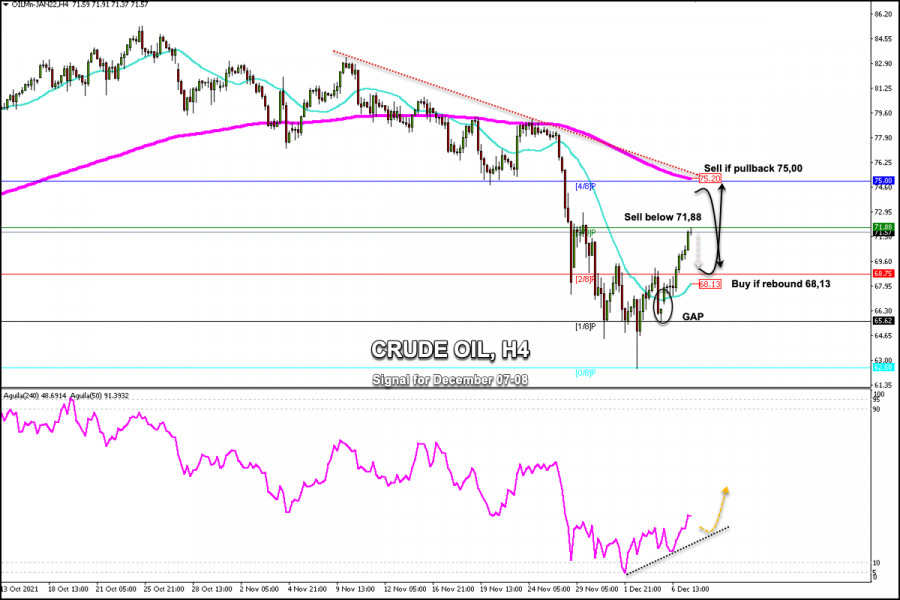
Since early Monday, the price of crude oil (#CL- WTI) began a strong technical correction, consolidating above the SMA of 21. Now it has reached the resistance of 71.88 where 3/8 Murray is located.

Oil has regained momentum due to the data and some evidence that the new COVID variant Omicron is not so serious, but there is still uncertainty. Crude's ongoing technical rebound has not been sufficient for the price to reach the resistance level of 75.00, which would be positive for WTI.

In the 4-hour chart, we can see that the price has left a GAP. Crude is likely to make a correction towards the 21-moving average around 68.13. If it manages to bounce around this zone, it could resume its bullish path towards the 200 EMA at 75.20.

On the other hand, if it manages to consolidate below 68.00, it is likely to cover the GAP and the price may fall again to the level of 65.62. As long as it remains above Murray's 2/8, there is a possibility that crude will continue to rise to the 75.00 level for the next few days.

Our trading plan for the next few hours is to sell below 71.88. If the pirce remains below this level, there is a possibility of a correction towards the 21-average. With a technical bounce at the 21 SMA, we can buy again with targets at 71.88 and up to 75.00.

The eagle indicator is oscillating above an uptrend channel. A correction is expected in the coming hours, so that the bullish bias towards the 75.20 level continues.

Support and Resistance Levels for December 07 - 08 2021

Resistance (3) 75.20

Resistance (2) 74.53

Resistance (1) 72.33

----------------------------

Support (1) 68.96

Support (2) 67.24

Support (3) 65.59

***********************************************************

A trading tip for WTI on December 07 - 08, 2021

Buy in case of rebound at 68.13 (21 SMA) with take profit at 71.88 (3/8) and 75.20 (200 EMA), stop loss below 67.50.

เลือกช่วงเวลา
5
นาที
15
นาที
30
นาที
1
ชั่วโมง
4
ชั่วโมง
1
วัน
1
สัปดาห์
รับผลกำไรจากการเปลี่ยนแปลงอัตราสกุลเงินดิจิทัลกับ InstaForex.
ดาวน์โหลด MetaTrader 4 และเปิดการซื้อขายครั้งแรกของคุณ.
การวิเคราะห์ EUR/USD - 31 มีนาคม โครงสร้างคลื่นบนแผนภูมิ 4 ชั่วโมงของ EUR/USD กำลังมีความเสี่ยงที่จะเปลี่ยนรูปร่างเป็นรูปแบบที่ซับซ้อนยิ่งขึ้น ในวันที่ 25 กันยายนปีที่ผ่านมา โครงสร้างลดลงใหม่เริ่มที่จะการสร้างและอยู่ในรูปแบบของลัพธ์คลื่นห้า สามเดือนที่ผ่านมา โครงสร้างแก้ไขขึ้นเริ่มที่จะการสร้างในที่ควรจะประกอบด้วยคลื่นอย่างน้อยสามคลื่น โครงสร้างของคลื่อแรกถูกสร้างขึ้นอย่างดีและจึงทำให้ฉันคาดว่าคลื่นที่สองจะต้องมีรูปร่างที่ชัดเจนเช่นเดียวกัน อย่างไรก็ตาม ขนาดของคลื่นนี้ใหญ่มากจนเป็นอันตรายถ้ามันเปลี่ยนรูปแบบคลื่นอย่างมาก ข่าวสารที่ส่งออกมายังคงสนับสนุนผู้ขายมากกว่าผู้ซื้อเมื่อมาถึงข้อมูลทางเศรษฐกิจ
  • Grand Choice
    Contest by
    InstaForex
    InstaForex always strives to help you
    fulfill your biggest dreams.
    เข้าร่วมการแข่งขัน


บทความแนะนำ

ตลาดหุ้นวันที่ 31 มีนาคม: S&P 500 และ Nasdaq ใกล้แตะจุดต่ำสุดประจำปี

เมื่อสิ้นสุดเซสชันการซื้อขายปกติของวันศุกร์ ดัชนีหุ้นสหรัฐปิดในแดนลบ ดัชนี S&P 500 ลดลง 1.97% ขณะที่ Nasdaq 100 ลดลง 2.70% ส่วนดัชนี Dow Jones

Jakub Novak 12:27 2025-03-31 UTC+2

ตลาดหุ้นสหรัฐร่วงลงจากการเคลื่อนไหวของภาษีของทรัมป์และสัญญาณเศรษฐกิจที่อ่อนแอ

S&P 500 ภาพรวมสำหรับวันที่ 31 มีนาคม ตลาดสหรัฐเห็นการลดลงอย่างรุนแรง ดัชนีดิ่งสู่ระดับต่ำสุดในรอบหนึ่งปีเนื่องจากการดำเนินมาตรการภาษีของทรัมป์ ดัชนีหลักของสหรัฐในวันศุกร์: Dow: -1.7%, NASDAQ: -2.7%, S&P 500: -2.0%

Jozef Kovach 10:12 2025-03-31 UTC+2

ตลาดหุ้นวันที่ 28 มีนาคม: S&P 500 และ NASDAQ ในสถานการณ์ที่ลำบาก

ดัชนีหุ้นสหรัฐสิ้นสุดลงด้วยการปิดตลาดเมื่อวานนี้ ปิดในแดนลบ โดยดัชนี S&P 500 ลดลง 0.33%, Nasdaq 100 ลดลง 0.53% และ Dow Jones Industrial

Jakub Novak 10:29 2025-03-28 UTC+2

ตลาดหุ้นสหรัฐ: ภาษีของทรัมป์หยุดแนวโน้มขาขึ้น ดังนั้นดัชนีหุ้นชั้นนำจึงอยู่ในช่วงการรวมตัวกัน ข้อมูล PCE อยู่ในความสนใจของนักลงทุนวันนี้

S&P500 อัพเดทตลาดวันที่ 28 มีนาคม ตลาดหุ้นสหรัฐ: ภาษีของ Trump หยุดแนวโน้มขาขึ้น ทำให้ดัชนีหุ้นมาตรฐานอยู่ในช่วงการปรับตัว ข้อมูล PCE อยู่ในเรดาร์ของนักลงทุนวันนี้ ภาพรวมตลาดหุ้นสหรัฐเมื่อวันพฤหัสบดี: Dow -0.4%

Jozef Kovach 08:46 2025-03-28 UTC+2

ตลาดหุ้นสหรัฐฯ ร่วงลงเมื่อภาษีของทรัมป์ลดความเชื่อมั่นในมุมมองทางเศรษฐกิจ

S&P 500 สรุปผลวันที่ 27 มีนาคม ตลาดหุ้นสหรัฐฯ ลดลงเนื่องจากความกังวลเรื่องการเรียกเก็บภาษีและความไม่แน่นอนทางเศรษฐกิจที่กลับมาอีกครั้ง ดัชนีสำคัญของสหรัฐฯ ในวันพุธ: Dow: -0.3%, NASDAQ: -2.0%, S&P

Jozef Kovach 08:58 2025-03-27 UTC+2

ตลาดหุ้นวันที่ 27 มีนาคม: S&P 500 และ NASDAQ ร่วงหนักหลังทรัมป์ประกาศใช้ภาษีใหม่

เมื่อสิ้นสุดการซื้อขายในวันอังคาร ดัชนีหุ้นสหรัฐอเมริกาปิดตลาดในแดนลบ โดย S&P 500 ลดลง 1.12% ในขณะที่ Nasdaq 100 ลดลง 2.24% ส่วนดัชนี Dow Jones

Jakub Novak 08:43 2025-03-27 UTC+2

ตลาดหุ้นสหรัฐแสดงการเติบโตเล็กน้อย

S&P500 อัปเดตตลาดหุ้นในวันที่ 26 มีนาคม ภาพรวมดัชนีหุ้นสหรัฐในวันอังคาร: * Dow +0%, NASDAQ +0.5%, * S&P 500 +0.2%, *

Jozef Kovach 09:21 2025-03-26 UTC+2

อัปเดตตลาดหุ้นวันที่ 26 มีนาคม: S&P 500 และ NASDAQ ฟื้นตัวอย่างต่อเนื่อง

เมื่อปิดการซื้อขายปกติเมื่อวานนี้ ดัชนีหุ้นสหรัฐฯ ได้ปิดในแดนบวก โดย S&P 500 เพิ่มขึ้น 0.16% ในขณะที่ Nasdaq 100 เพิ่มขึ้น 0.46% ส่วน

Jakub Novak 08:44 2025-03-26 UTC+2

ตลาดหุ้นสหรัฐได้รับแรงผลักดันเชิงบวกใหม่อีกครั้ง นักลงทุนเข้าใจสัญญาณว่าการปรับฐานขาลงสิ้นสุดลงแล้ว

S&P 500 การอัปเดตตลาดเมื่อวันที่ 25 มีนาคม ภาพรวมของตลาดหุ้นสหรัฐฯ ในวันจันทร์: Dow +1.4%, NASDAQ +2.3%, S&P 500 +1.8%, S&P

Jozef Kovach 11:08 2025-03-25 UTC+2

ตลาดหุ้นมีความเสี่ยงที่จะลดลง

เมื่อวานนี้ ดัชนีหุ้น S&P 500 ปิดปรับตัวเพิ่มขึ้นอย่างแข็งแกร่งที่ 1.76% ถึงระดับเป้าหมายที่ 5769 (ซึ่งเป็นระดับต่ำสุดจากวันที่ 13 มกราคม) พร้อมกันนั้น เส้นสัญญาณของออสซิลเลเตอร์ Marlin ได้แตะขอบเขตของแนวโน้มขาขึ้น

Laurie Bailey 04:59 2025-03-25 UTC+2
หากไม่สะดวกคุยในตอนนี้
ระบุคำถามไว้ได้ใน แชท.
Widget callback
 

Dear visitor,

Your IP address shows that you are currently located in the USA. If you are a resident of the United States, you are prohibited from using the services of InstaFintech Group including online trading, online transfers, deposit/withdrawal of funds, etc.

If you think you are seeing this message by mistake and your location is not the US, kindly proceed to the website. Otherwise, you must leave the website in order to comply with government restrictions.

Why does your IP address show your location as the USA?

  • - you are using a VPN provided by a hosting company based in the United States;
  • - your IP does not have proper WHOIS records;
  • - an error occurred in the WHOIS geolocation database.

Please confirm whether you are a US resident or not by clicking the relevant button below. If you choose the wrong option, being a US resident, you will not be able to open an account with InstaForex anyway.

We are sorry for any inconvenience caused by this message.